Figure 6.
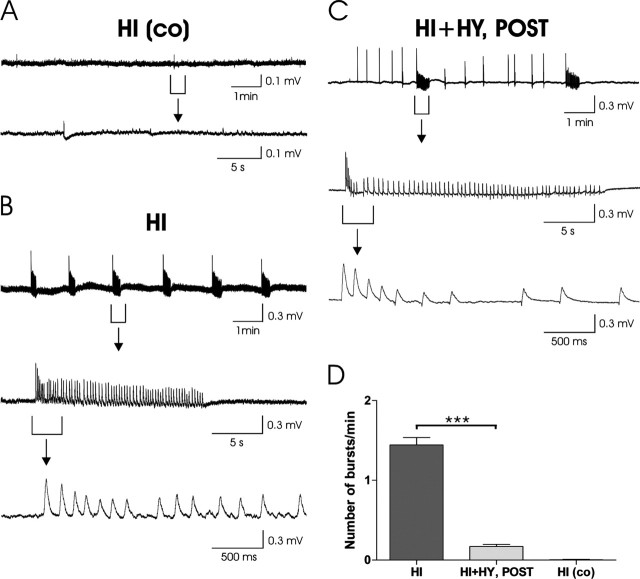
Spontaneous electrical activity recorded in the CA1 region of cultured hippocampal slices. A, A representative recording in a control hippocampal slice, HI (co). A sample trace showing a 10 min recording of spontaneous activity is shown (top). The bottom shows an expanded time scale trace taken from the same recording from the time interval indicated. B, Spontaneous activity after the 6 h KA treatment in HI shows intense ictal-type bursting. A 10 min sample recording is shown (top). Expanded time scales show the typical abrupt onset of the burst followed by repetitious positive discharges (middle, bottom). C, In HI plus HY (POST), only occasional bursts were detected, whereas inter-ictal type activity occurred frequently. The top shows a 10 min sample recording. The middle and bottom show an expanded time scale showing a typical isolated positive discharge. D, The mean (±SEM) number of KA-induced bursts/min during the 20 min recording period was significantly (***p < 0.001) lower in HI plus HY (POST) compared with HI.

