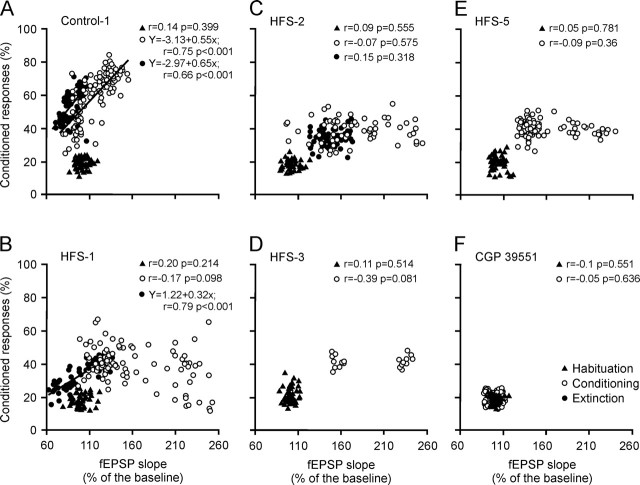
Figure 3.
Quantitative analysis of the relationships between percentage of conditioned responses and fEPSP slopes for the different experimental groups during habituation, conditioning, reconditioning, and extinction sessions. A–F, Data collected from controls (A), HFS-1 (B), HFS-2 (C), HFS-3 (D), HFS-5 (E), and CGP 39551 (F) groups. Each point represents the mean value collected from a single animal during the corresponding session. Data collected from habituation (black triangles), conditioning or reconditioning (open circles), and extinction (filled circles) sessions are illustrated. Represented data for conditioning and extinction sessions correspond exclusively to those collected after HFS sessions. Regression lines and their corresponding equations are included only for coefficients of correlation (r > 0.6). The p values for each regression analysis are always indicated.

