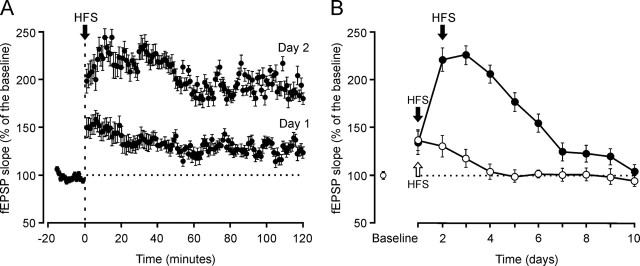
Figure 4.
LTP induction in the CA1 area after electrical stimulation of the Schaffer collaterals. A, LTP induction in the same animal. The HFS was presented for two consecutive days. The fEPSP is given as a percentage of the baseline (100%) slope. To obtain a baseline, animals were stimulated every 5 s for 15 min at Schaffer collaterals. After HFS, the same stimulus was presented at the same rate (12 per min) for 2 h. B, LTP induction in two groups of animals (n = 5 each). One group of animals received HFS trains for only 1 d (open arrow and circles), whereas the other group was stimulated for 2 d (black arrows and filled circles). To check LTP evolution, animals were stimulated daily at Schaffer collaterals every 5 s for 15 min. Values are expressed as mean ± SD.

