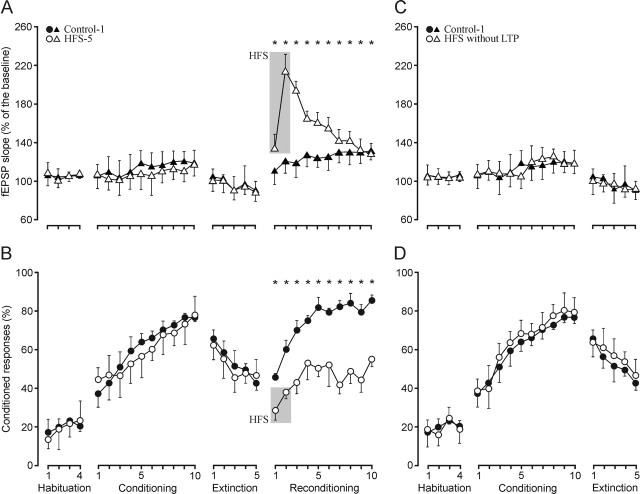
Figure 7.
Learning curves and evolution of the synaptic field potential for controls, group HFS-5, and animals unable to evoke LTP after two sessions of HFS. A, B, fEPSP slope (A, open triangles) and percentage (B, circles) of conditioned responses from animals receiving HFS (gray lane) before the last two reconditioning sessions (HFS-5 group). For comparative purposes, data collected from the control group are also indicated (A, fEPSP, black triangles; B, percentage of responses, filled circles). As a result of the LTP evoked by HFS, the fEPSP slope for the HFS-5 group was significantly larger than baseline values during the 10 d of reconditioning (F(13, 117) = 6.09; *p < 0.01). After the two HFS sessions, the learning curves presented by the HFS-5 group were significantly (F(13, 117) = 207.4; *p < 0.001) different from those of controls during the 10 conditioning sessions. C, D, fEPSP slope (C, open triangles) and percentage (D, circles) of conditioned responses from animals (n = 17) receiving two HFS sessions, but not presenting any noticeable potentiation. Data corresponding to the control group are also indicated (C, black triangles; D, filled circles). Note that these HFS animals presented acquisition curves (F(18, 162) = 175.6; *p = 0.23) and fEPSP slopes (F(18, 162) = 68; *p = 0.41) nonsignificantly different from controls. Values are expressed as mean ± SD.

