
Figure 4.
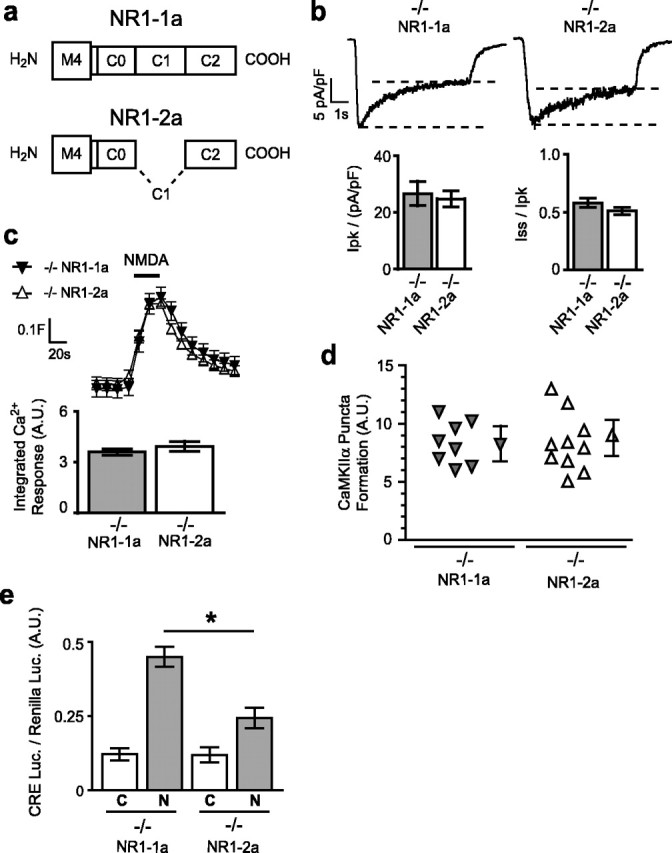
Splice variants NR1–1a and NR1–2a differentially induce gene expression. a, Domains of the NR1 C terminus for NR1–1a and NR1–2a. b, Sample traces of whole-cell currents induced by NMDA (100 μm for 5 s) for NR1–1a and NR1–2a; quantification of the normalized peak [Ipk/(pA/pF)] and steady-state (Iss/Ipk) currents revealed no significant difference between NR1−/− neurons transfected with NR1–1a and NR1–2a. c, Reconstituted [Ca2+]i responses to NMDA have similar profiles in NR1−/− neurons transfected with NR1–1a or with NR1–2a (traces, mean ± SEM fura-2 ratio at least 14 neurons). Column graphs show the quantification of integrated area of [Ca2+]i responses; each condition represents the mean ± SEM for at least 14 neurons from at least four embryos. d, No significant difference was observed in NMDA-induced puncta formation by GFP-CaMKIIα in neurons transfected with NR1–1a or NR1–2a. Mean ± SEM for at least four experiments. e, CRE-dependent luciferase gene expression was significantly less in NR1−/− neurons transfected with NR1–2a than with NR1–1a. Mean ± SEM for at least four independent experiments. A.U., Arbitrary units; C, control; N, NMDA.