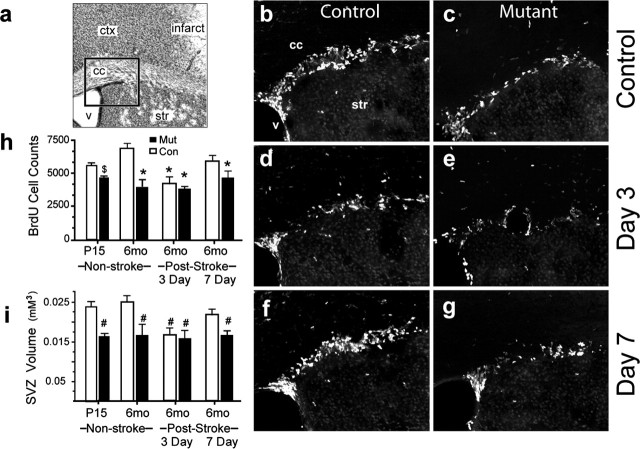
Figure 3.
Quantification of BrdU labeling in the SVZ. a, Cresyl violet section. The rectangle shows the location of b–g. b–g, BrdU-labeled cells in control (b, d, f) and EpoR conditional knock-down (c, e, g) animals in non-stroke (b, c), 3 d after stroke (d, e), and 7 d after stroke (f, g) are shown. Scale bar, 50 μm. h, i, The graphs show quantifications of BrdU-labeled cells (h) and SVZ volume before and after stroke (i). *p ≤ 0.004; #p ≤ 0.008; $p = 0.016. Error bars indicate SDs. ctx, Cortex; str, stiatum; V, ventricle; cc, corpus callosum; P15, postnatal day 15; mo, month; Con, control; Mut, mutant.

