Figure 4.
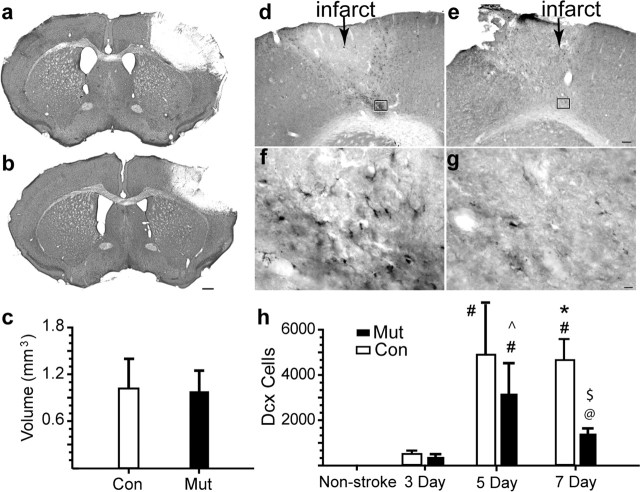
EpoR conditional knock-down leads to reduced neuroblast migration. a, b, Cresyl violet sections through the frontal cortex of mutant (a) and control (b) 7 d after stroke. Scale bar, 500 μm. c, Infarct volume 7 d after stroke was quantified. d–g, DCX+ cells in control (d, f) and mutant (e, g). The region within the box in d and e is enlarged in f and g. Scale bars: d, 100 μm; f, 25 μm. h, Stereological quantification of DCX+ cells. #p ≤ 0.001 versus all other conditions; *p = 0.008 versus Mut at non-stroke stage; ^p = 0.02 versus Mut at 7 d; @p < 0.02 versus 3 d Mut/Con and non-stroke; $p = 0.002 versus 7 d control. Error bars indicate SDs.

