
Figure 7.
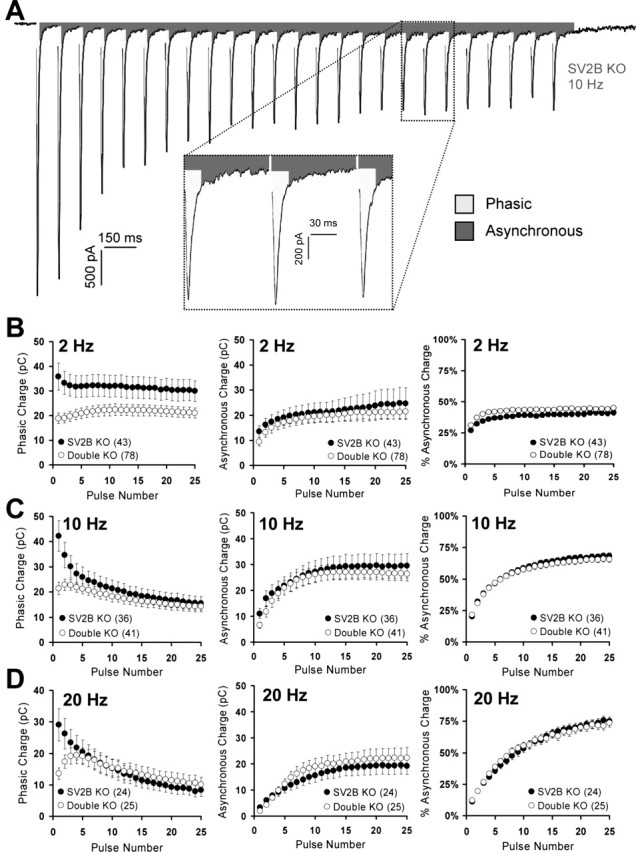
Loss of SV2 does not increase asynchronous release. Trains of 25 stimuli were evoked at 2, 10, and 20 Hz. Phasic and asynchronous components of release were determined as described in Materials and Methods. Data points represent mean ± SEM, with the number of cells analyzed indicated in parentheses. Data represent cultures from six (2 Hz), seven (10 Hz), and seven (20 Hz) sets of littermates. A, Representative trace from an SV2B knock-out neuron stimulated at 10 Hz illustrating the regions that were considered phasic release (light-shaded regions) and asynchronous release (dark-shaded regions). B–D, Left, Phasic release at 2 Hz (B), 10 Hz (C), and 20 Hz (D). Note that, for initial stimuli, phasic release is reduced in SV2A/B double knock-outs, consistent with reduced EPSC amplitudes as shown in Figures 1 and 3. B–D, Middle, Asynchronous release at 2 Hz (B), 10 Hz (C), and 20 Hz (D). Asynchronous release increased throughout the train and was similar in SV2B and SV2A/B knock-outs. Note that asynchronous release in SV2A/B double knock-outs never exceeds that of SV2B knock-outs. B–D, Right, Percentage of asynchronous release at 2 Hz (B), 10 Hz (C), and 20 Hz (D). The proportion of total release that was asynchronous was not altered at 10 and 20 Hz. At 2 Hz, SV2A/B double knock-out neurons demonstrated a small but significant increase in the proportion of asynchronous release in responses 1–8 and 12.