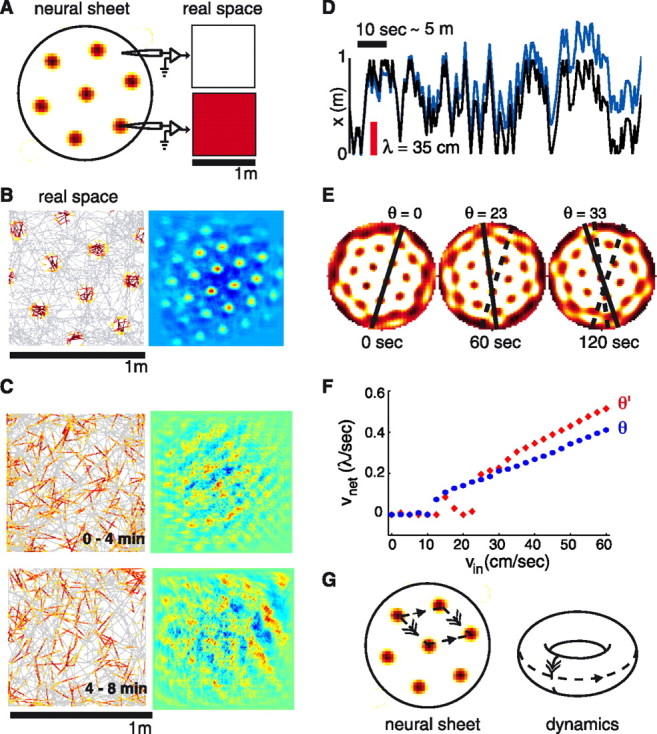
Figure 1.

A, Synaptic connectivity with local excitation and longer-range local inhibition (data not shown) leads to the formation of triangular lattice patterns on the neural sheet. Right, Uncoupled to velocity inputs, the pattern is static: individual neurons are always on or always off, independent of rat position. B, Left, Single-neuron responses would resemble dMEC activity if the network pattern performed rigid translations in direct proportion to rat velocity (Right, autocorrelation). The figure is generated by artificially translating the population activity in tandem with simulated rat movements, and plotting the response of a representative model neuron from the neural sheet. C, Single-neuron responses (left), with their autocorrelations (right) generated from the Fuhs and Touretzky (2006) model using a semirandom rat trajectory (over 4 min intervals, ∼120 m), do not resemble dMEC activity. Simulation details are from Fuhs and Touretzky (2006), but we modified the narrow velocity tuning curves into cosine tuning curves to provide equitably weighted velocity input to the network for motion along any direction. D, Rat trajectory (black) and tracked network response (blue) over ∼50 m of movement at speeds <0.5 m/s (only x-coordinate shown; y is similar). Red scale bar: 1 lattice period, compared with which errors should be small for coherent single-neuron grids. E, The network (population) pattern undergoes frequent rotations during the trajectory used in C and D instead of performing pure translation. F, Network response, vnet, to velocity inputs, vin: instead of varying linearly as a function of only rat velocity, network response is pinned for rat speeds less than ∼15 cm/s (when the network gain is set to produce single-neuron grids of a period ∼35 cm), and depends on the relative angle between lattice orientation and rat velocity. The network received 5 s steps of constant-velocity input in the x direction, and the translation of the pattern was measured over the last 2.5 s. Red diamonds and blue circles correspond to two different initial pattern orientations relative to the x-axis. G, Although the neural network boundary is aperiodic, the network dynamics are periodic by virtue of the periodicity of the neural pattern and attributable to spontaneous pattern completion during the velocity-driven flow of network activity.
