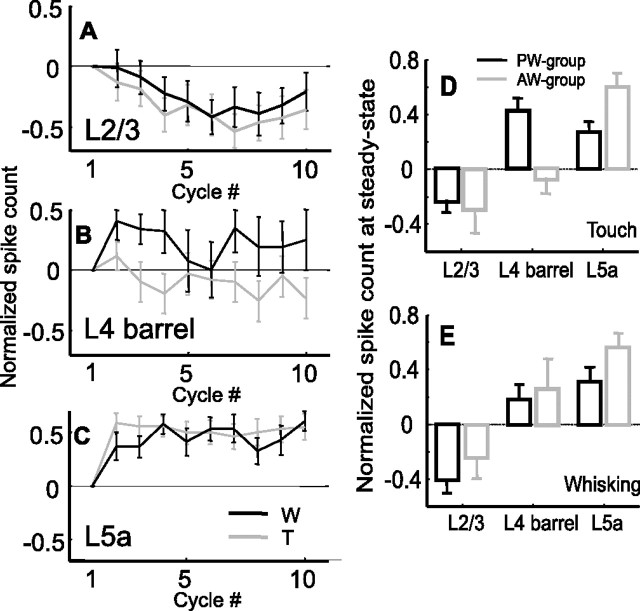
Figure 5.
Dynamics of spike counts of AW neurons during protraction and comparison with responses to PW. A–C, Mean normalized protraction spike count of the AW group during artificial whisking in free air (black line) and against an object (gray line). A, Layer 2/3 (n = 17). B, Layer 4-barrels (n = 9). C, Layer 5a (n = 17). D, E, Comparison of the mean steady-state (cycles 5–10) normalized responses of the cortical layers for the PW (black) and AW (gray) groups for the Touch (D) and Whisking (E) conditions. Spike counts were measured during the first 60 ms from whisk onset and normalized according to the response in the first cycle. W, Whisking condition; T, touch condition.

