
Figure 4.
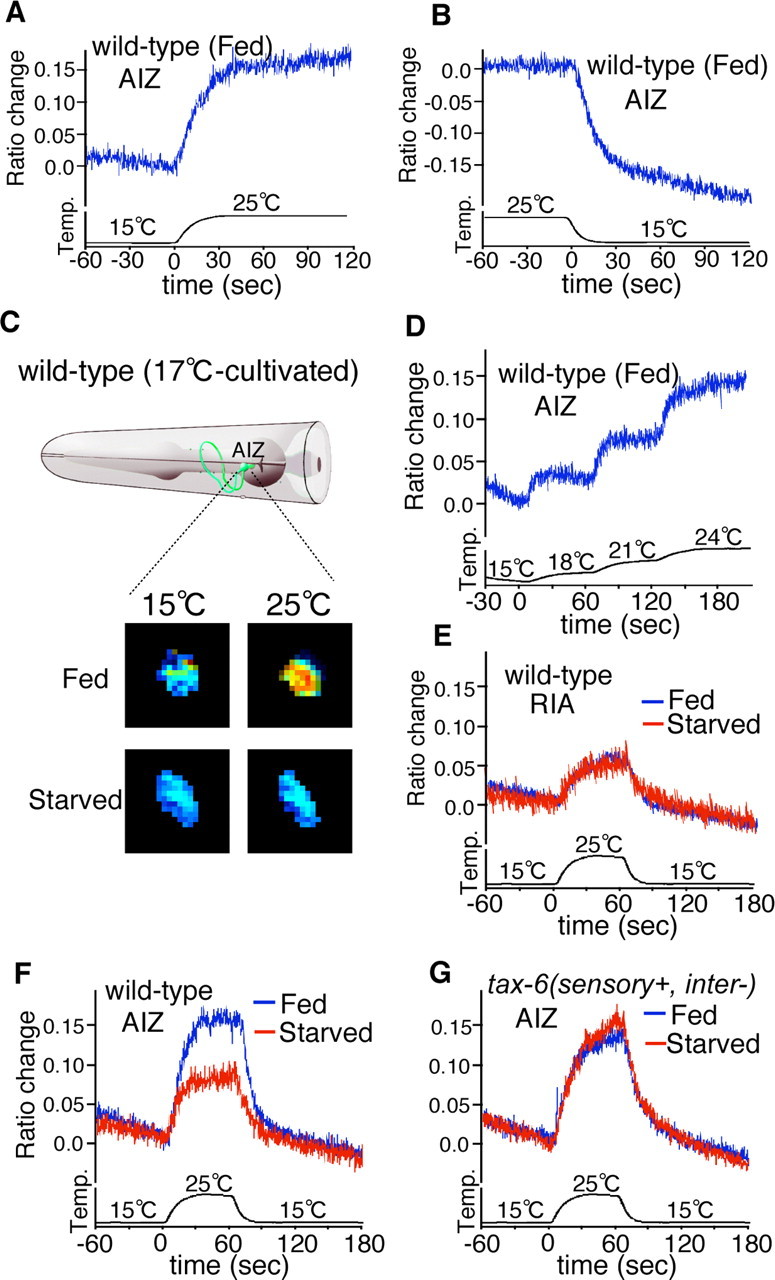
In vivo calcium ratio imaging of the neural circuit for feeding state-dependent thermotactic plasticity. Calcium ratio imaging of AIZ (A–D, F, G) and RIA interneurons (E) in 17°C-grown animals cultivated under the fed or starved condition. Each graph represents the average response of AIZ or RIA interneurons to thermal stimuli. Each data were aligned at stimulus onset. Relative increases or decreases in the intracellular calcium concentration were measured as increases or decreases in the YFP/CFP fluorescence ratio of the cameleon protein (ratio change), respectively. Temperature (temperature) is shown as a thin black line at the bottom of the graph. A, The AIZ interneuron in wild type responds to warming. The average ratio change from baseline ± SEM is 0.143 ± 0.008; n = 12. B, The AIZ interneuron in wild type responds to cooling. The average ratio change from baseline ± SEM is −0.155 ± 0.013; n = 11. C, A schematic diagram of an AIZ interneuron (green, top) in the C. elegans head, and corresponding pseudocolor images (bottom) depicting the fluorescence ratio before (left) and during (right) temperature changes. Blue and red pixels represent lower and higher fluorescence ratios, respectively. D, The AIZ interneurons respond to step-like temperature changes; n = 10. E, Calcium ratio imaging of RIA interneurons in wild-type animals cultivated under the fed or starved condition. The average ratio changes from baseline ± SEM are 0.04 ± 0.004 (fed) and 0.038 ± 0.007 (starved). Fed, n = 10; starved, n = 10. F, Calcium ratio imaging of AIZ interneurons in wild-type animals cultivated under the fed or starved condition. Fed, n = 20; starved, n = 21. The average ratio changes from baseline ± SEM are 0.145 ± 0.009 (fed) and 0.073 ± 0.010 (starved). G, Calcium ratio imaging of AIZ interneurons in tax-6(sensory+, inter−) mutant animals cultivated under the fed or starved condition. The average ratio changes from baseline ± SEM are 0.122 ± 0.010 (fed) and 0.140 ± 0.013 (starved). Fed, n = 21; starved, n = 27.