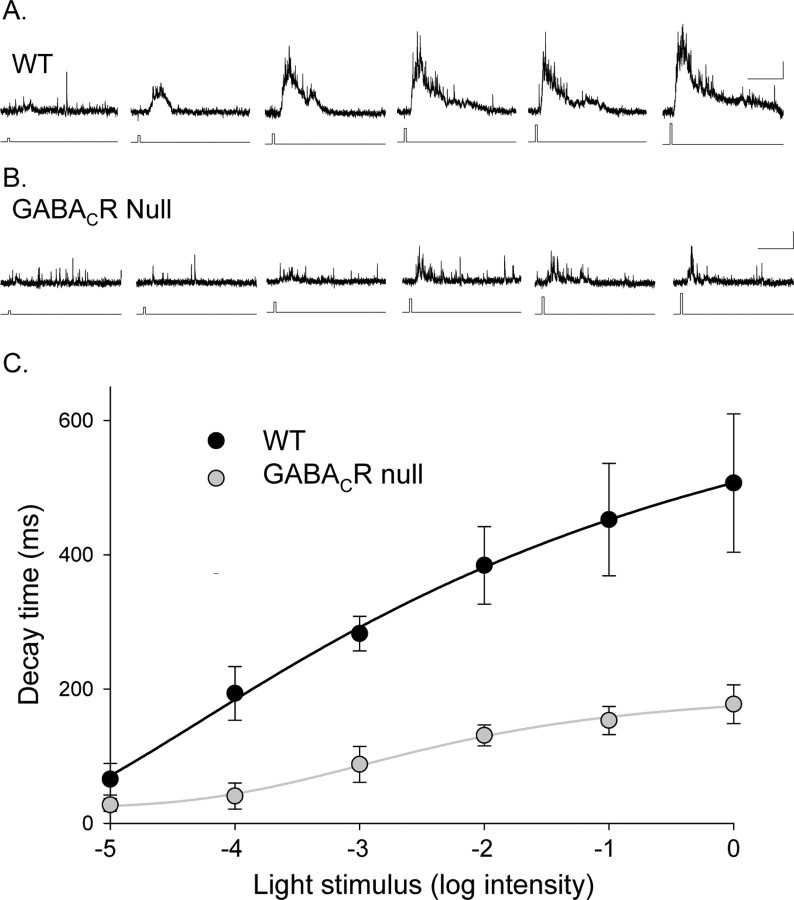
Figure 8.
Eliminating GABAC receptors reduced the decay time of rod bipolar cell L-IPSCs as a function of light intensity. A, L-IPSCs from a WT rod bipolar cell in response to increasing intensities of light (30 ms light stimulus). Calibration: 5 pA, 500 ms. B, L-IPSCs from a GABACR null rod bipolar cell in response to increasing intensities of light. The increases in the magnitude and decay of the response are smaller for the GABACR null mice. C, The average L-IPSC D37 values from WT (n = 10) and GABACR null (n = 6) mice are plotted as a function of light intensity (log relative intensity). The curves are the best fits to a logistic function. The maximum D37 of the GABACR null curve was 35% of the WT maximum. The L20–80 values of the fits were not significantly changed (WT, 2.1 ± 0.8; null, 2.4 ± 0.8), but the GABACR null curve had a lower EC50 (WT, −3.4 ± 0.2; null, −2.7 ± 0.2).

