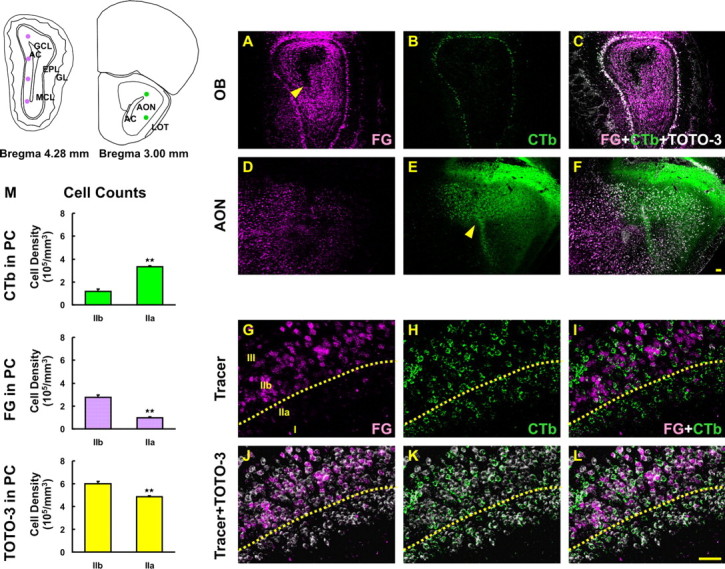
Figure 5.

Retrograde labeling in PC after injection of tracers into OB and AON. The simplified diagram depicts the injection sites of FG in OB and CTb in AON. A, D, G, FG (violet) was injected in OB (A, arrowhead) and retrogradely transported into AON (D) and PC (G). B, E, H, CTb (green) was injected in AON (E, arrowhead) and retrogradely transported back to OB (B) and into PC (H). C, F, J–L, Sections were counterstained with TOTO-3 iodide (white). I, FG-labeled cells were found predominantly in layer IIb whereas CTb-labeled cells were in layer IIa. M, Labeled cells were stereologically counted and the data represent a significant difference between two subsets of pyramidal cells in layers of IIa and IIb (two-tailed Student’s t test, **p < 0.01). Data are means + SEM (n = 3). Scale bars, 50μm.
