
Figure 3.
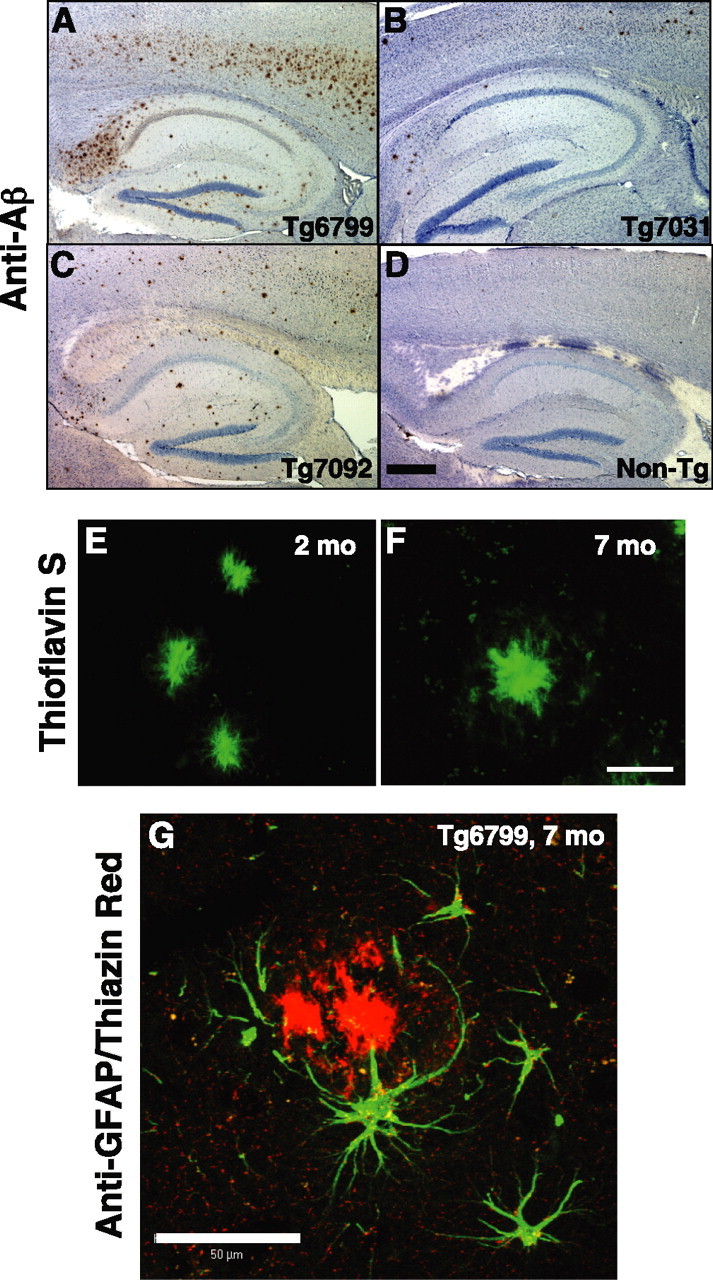
Amyloid deposition and gliosis in 5XFAD lines. Parasagittal serial sections of brains from Tg6799 (A, E–G), Tg7031 (B), Tg7092 (C), and nontransgenic control (D) mice were stained with anti-Aβ (4G8; A–D), thioflavin S (E, F), or anti-GFAP and thiazin red (G) and imaged by bright-field (A–D) or confocal (E–G) microscopy. Ages of mice were 2 (E), 6 (A–D), and 7 (F, G) months. A–D, Shown are sections including the hippocampus and cortex of representative 6-month-old 5XFAD mice from each line stained with anti-Aβ (brown) and hematoxylin (blue). Across the 5XFAD lines, the relative amounts of amyloid burden (and gliosis; data not shown) correlated with Aβ42 levels as measured by ELISA (Fig. 2). Scale bar (in D): A–D, 1 mm. E, F, Brain sections of representative 2-month-old (E) and 7-month-old (F) Tg6799 mice were stained with thioflavin S (green). Amyloid deposits labeled strongly with thioflavin S, indicating that Aβ was in an aggregated β-pleated sheet conformation. Note that plaque sizes (∼20 μm) are similar to those of large neuron cell bodies (data not shown). Scale bar (in F): E, F, 20 μm. G, Activated astrocytes around a Tg6799 plaque. Brain section of a representative 7-month-old Tg6799 mouse costained with thiazin red (to label β-pleated sheet amyloid) and anti-GFAP antibody (green). The astrocytes adjacent to the amyloid plaque display ramified processes and express GFAP, indicative of an activated phenotype associated with inflammation. Scale bar, 50 μm.