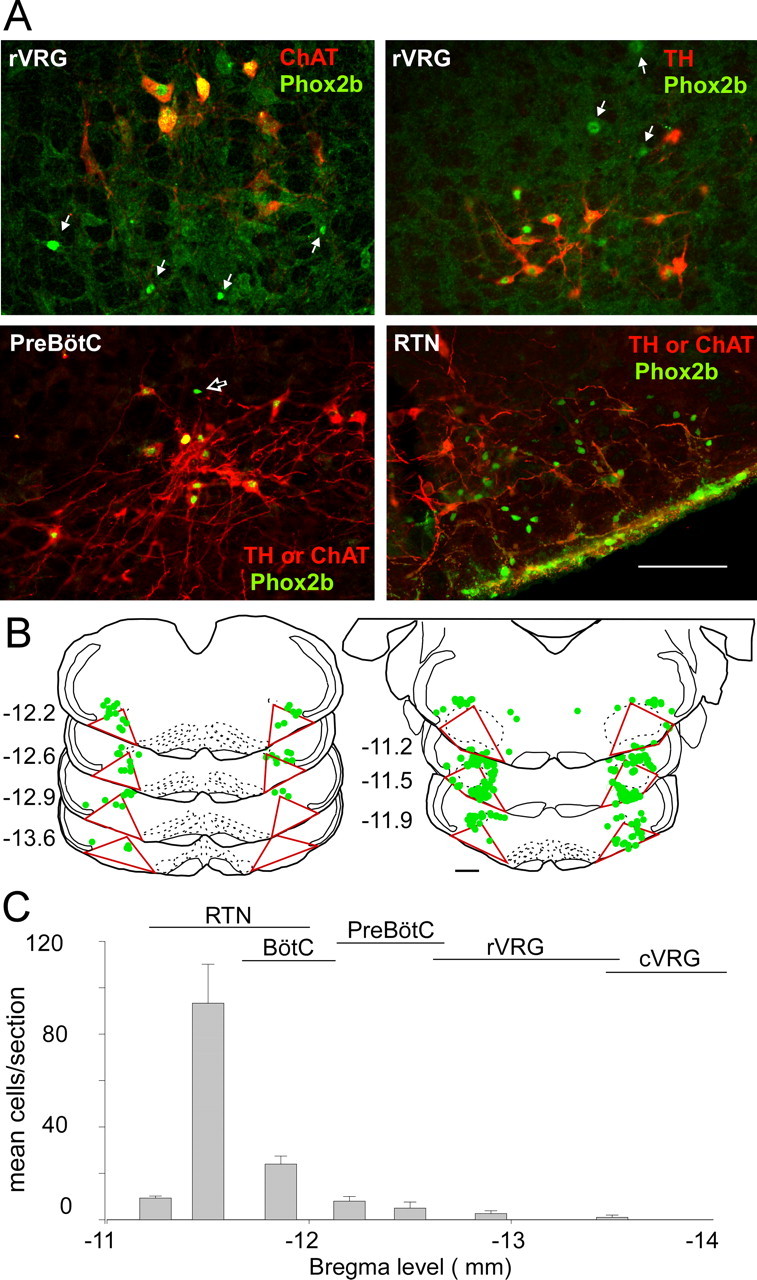
Figure 6.

VRC neurons that express Phox2b but neither TH nor ChAT are confined to the RTN. A, Top left, VRC at bregma level −13.3 mm (rVRG) in a section reacted for detection of Phox2b (Alexa 488; green) and ChAT (Cy3; red). All ChAT-ir neurons have Phox2b-ir nuclei. White arrows point to Phox2b-ir nuclei that are not associated with cholinergic neurons. Top right, VRC (rVRG; bregma level, −13.3) in a section reacted for detection of Phox2b (Alexa 488; green) and TH-ir (Cy3; red). Many TH-ir neurons have Phox2b-ir nuclei. White arrows point to Phox2b-ir nuclei that are not associated with catecholaminergic neurons but likely belong to cholinergic motor neurons (based on location and nuclear size). Bottom left, VRC at bregma −12.6 mm (pre-Bötzinger complex level) in a section reacted for simultaneous detection of Phox2b (Alexa 488; green), TH, and ChAT. In this experiment, TH and ChAT are both labeled with Cy3-tagged secondary antibodies, and therefore both appear in red. Black arrow points to the only Phox2b-ir neuron that lacks ChAT or TH. Bottom right, RTN region in a section reacted as in the bottom left panel (TH and ChAT both appear in red). In the RTN, the vast majority of Phox2b-ir neurons are neither cholinergic nor catecholaminergic and this population probably identifies the putative central chemoreceptors. Scale bar: top panels, 100 μm; bottom panels, 200 μm. B, Computer-assisted plot of noncatecholaminergic and noncholinergic Phox2b-ir neurons in the lower medulla of one rat. The numbers at the left of the sections refer to the level behind bregma. The VRC is delineated by the triangles drawn on each section. This triangle joins three objective landmarks: the bottom of nucleus ambiguus, the edge of the pyramidal tract, and the edge of the trigeminal tract. C, Rostral–caudal distribution of the putative central chemoreceptors identified as noncatecholaminergic, noncholinergic Phox2b-expressing neurons of the VRC. The approximate rostrocaudal extent of the various subdivisions of the VRC [after Alheid et al. (2002)] are indicated. Error bars indicate SEM. For abbreviations, see Figure 1.
