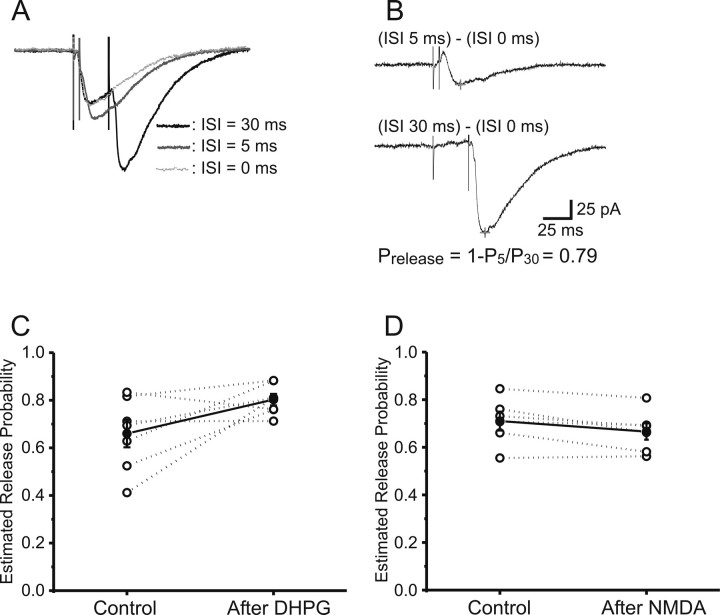
Figure 3.
Synaptic refractory period provides a measure of release probability (Pr) but does not detect any change in Pr associated with either NMDA-LTD or mGluR-LTD. A, Typical Schaffer collateral-evoked EPSCs (means of 15 traces each) recorded from a CA1 pyramidal neuron using three paired-pulse interstimulus intervals of 0, 5, and 30 ms. B, The top trace shows the subtraction of the first EPSC from the second one evoked at a 5 ms interval, whereas the bottom trace is the subtraction of the first response from that at the 30 ms interstimulus interval. Because presynaptic sites that release on the first stimulus are absolutely refractory after 5 ms but not 30 ms, the ratio of second-response amplitudes at 5 ms/30 ms is a direct function of Pr [see Results and Hjelmstad et al. (1997)]. Calibration: 25 pA, 25 ms. C, Plot of individual (open circles) and mean ± SEM (filled circles; n = 7) estimated Pr before (Control) and 20 min after induction of mGluR-LTD [25 μm (S)-DHPG, 5 min]. D, Plot of individual (open circles) and mean ± SEM (filled circles; n = 6) estimated Pr before (Control) and 20 min after induction of NMDA-LTD. ISI, Interstimulus interval.

