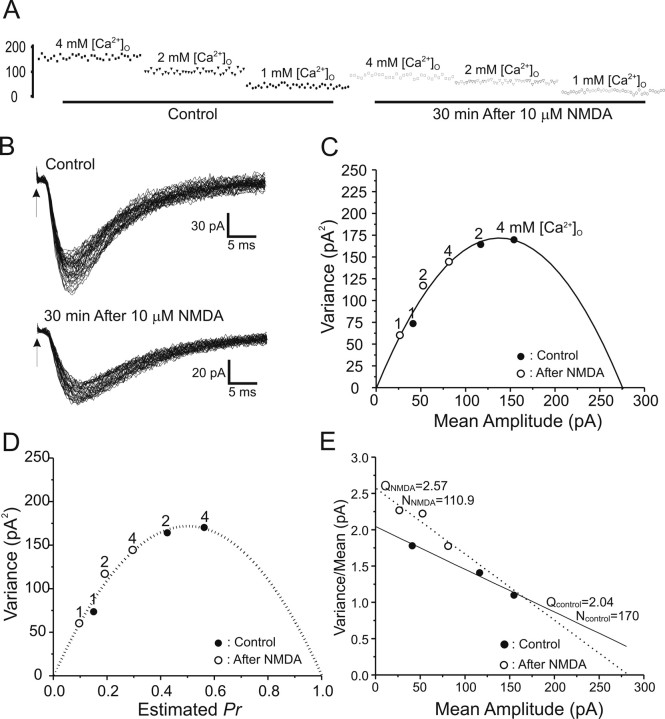
Figure 4.
Typical VM analysis of peak EPSCs before and during NMDA receptor-dependent LTD. A, EPSC peak amplitudes (in picoamperes) recorded at 1, 2, and 4 mm [Ca2+]o as denoted, before (left) and 30 min after (right) exposure to 10 μm NMDA for 3 min. B, EPSC trace envelopes before (Control) and 30 min after (30 min After 10 μm NMDA) induction of NMDA-LTD (arrows indicate stimulus onset) C, A typical plot of variance versus mean peak EPSC amplitudes at [Ca2+]o of 1, 2, and 4 mm as indicated, before (filled circles) and 30 min after (open circles) exposure to 10 μm NMDA for 3 min. The line is the best parabolic fit forced to pass through 0,0. All data points before and during NMDA-LTD were well fit by the same parabola, consistent with a presynaptic reduction in Pr. D, An example of estimating release probability by parabolic fitting. Mean amplitudes on the x-axis are normalized with the estimated cross between the parabolic curve and x-axis. The normalized scale on the x-axis thus represents estimated Pr. The fact that data points before (filled circles) and during (open circles) NMDA-LTD fall on the same parabola indicates that this form of LTD is associated with a reduction in presynaptic Pr. E, Plot of variance/mean ratio versus mean EPSC amplitude (in picoamperes), which converts the parabolic relationship between mean and variance to a linear one. The number of release sites can be easily derived by estimating the slope of the linear fit, whereas the y-intercept denotes the quantal size of the EPSC. The increase in slope indicates that NMDA-LTD is associated with a reduction in presynaptic Pr.

