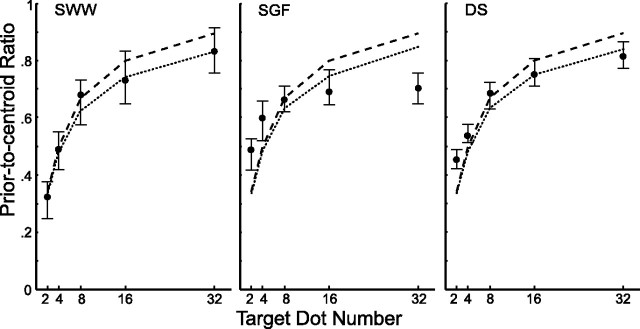
Figure 3.
Results of the main experiment. Filled circles indicate subjects' median normalized landing point as a function of the number of target dots. An ordinate value of zero indicates the subject aimed at the center of the prior; a value of 1 indicates a median value at the centroid of the sample dots. Error bars represent the 95% confidence interval of the median. The dashed line corresponds to the optimal aiming strategy for an ideal model that calculates the centroid of the dots perfectly. The dotted line corresponds to the optimal aiming strategy for each subject based on an estimate of that subject's variability in estimating the centroid of the dots added to the sampling variability of the centroid as an estimate of the target location.

