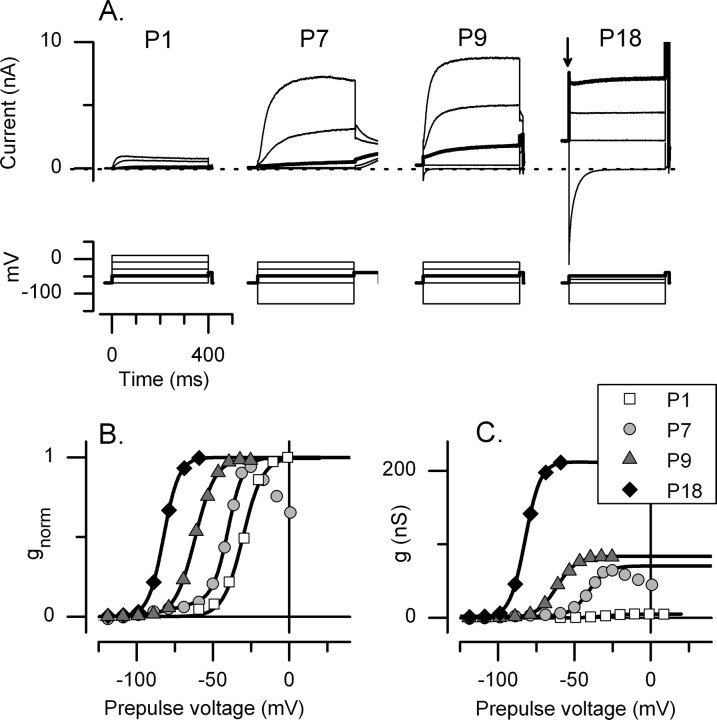
Figure 1.
Changes in outwardly rectifying K conductances of rat utricular hair cells during the first postnatal month. A, Currents evoked by voltage protocols (bottom) from type I hair cells at the postnatal ages shown. VH of −69 mV. Potential at step offset (tail potential) of −39 mV. Maximal outward currents and onset currents (at the step from VH; see arrow in P18 panel) increased with age. Voltage protocols overlap but are not identical across cells because they were designed to cover most of the voltage activation range for each cell (see B). Voltage commands (in millivolts): P1, −69, −49, −29, −9, 11; P7 and P9, −129, −69, −49, −29, −9; and P18, −129, −69, −59, −49. The trace at −49 mV in each panel has been bolded to allow comparison across cells. B, C, Normalized and non-normalized activation curves for the cells in A, fit with single Boltzmann functions (Eq. 1). For the cells P7–P18, the curves were generated from tail currents after 3 s voltage steps (illustrated in Fig. 3). V1/2, S, and gmax values are as follows: P1, −29 mV, 6.0 mV, 5 nS; P7, −40 mV, 5.3 mV, 68 nS; P9, −62 mV, 6.6 mV, 83 nS; P18, −82 mV, 5.0 mV, 210 nS.

