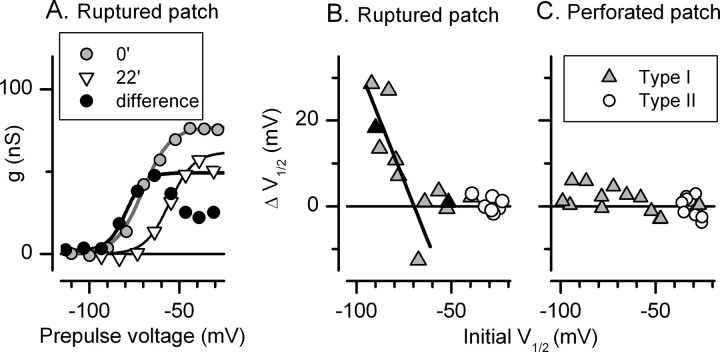
Figure 4.
A very negative component of the total K conductance washed out during ruptured-patch recordings, leaving a more positive component. A, P14 type I cell. Initial activation curve, V1/2, S, and gmax of −70 mV, 7.4 mV, 76 nS. At 10 min later, the curve (not shown) was best fit with the sum of two Boltzmann functions (V1 of −82 mV, S1 of 2 mV; V2 of −58 mV; S2 of 6 mV). At 22 min, the activation curve was well fit by a single more positive Boltzmann function: V1/2, S, gmax of −56 mV, 7 mV, 57 nS. This component was stable for the rest of the recording. For the washed-out component (“difference”), V1/2, S, gmax were −80 mV, 5 mV, 47 nS, and the conductance turned over positive to −70 mV. B, Triangles, Time-dependent shift in V1/2 in 12 type I hair cells plotted against initial V1/2. Shifts were measured over intervals varying from 5 to 32 min. A linear regression of points with initial V1/2 values negative to −60 mV (line) had a slope of −1.1 mV/mV and an x-intercept of −67 mV; for more positive initial V1/2 values, no systematic shift was seen. The influence of initial V1/2 is shown by the two cells marked by black triangles. For each of these cells, the time between recordings was 5 min, but only the cell with the more negative activation curve experienced a shift. No shifts were seen for type II hair cells (open circles). C, In the perforated-patch configuration, the activation range for both type I and type II cells was stable. V1/2 for type I cells varied widely because data from young cells were included (see Fig. 2A).

