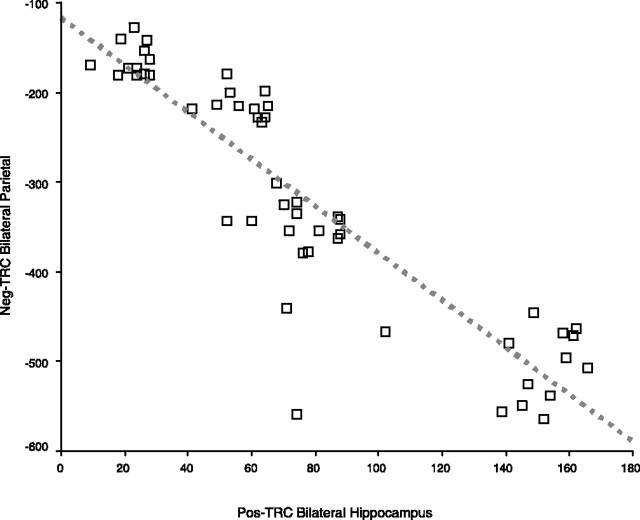
Figure 4.
Relationship between activation and deactivation within the task-related component. Scatterplot illustrates the association of Pos-TRC bilateral hippocampal activity with the extent of Neg-TRC bilateral parietal activity (Pearson's r = −0.896; p < 0.0001). The red dotted line represents the linear fit of this data. Note that the extent of deactivation is represented as a negative number, connoting a decrease in MR activity during task.

