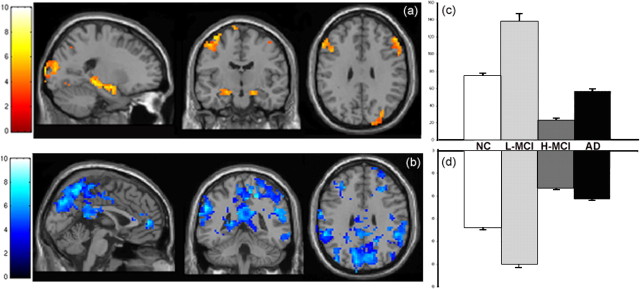
Figure 5.
Nonlinear trajectory within the task-related component. Sagittal, coronal, and axial slices through the brain display the regions with the strongest positive relationship to the multiple regression model tested (p < 0.001). a, Within the Pos-TRC, these regions include the left and right hippocampal formation, left and right inferior frontal gyrus, left cingulate gyrus, as well as the right dorsolateral prefrontal cortex. b, Within the Neg-TRC, the regions with the strongest positive relationship to the multiple regression model include the left anterior and posterior cingulate, the precuneus, as well as right and left lateral parietal cortex. (Note that the same regression model is tested in both a and b, and the colormap difference is a function of relationship of the regions to temporal time course of the paradigm.) c, d, Bar graphs display the nonlinear trajectory observed across groups as measured by voxel counts (error bars indicate SE) within the bilateral hippocampus within the Pos-TRC as well as the bilateral parietal regions within the Neg-TRC. Both ROI showed significant differences between all groups (p < 0.0001).

