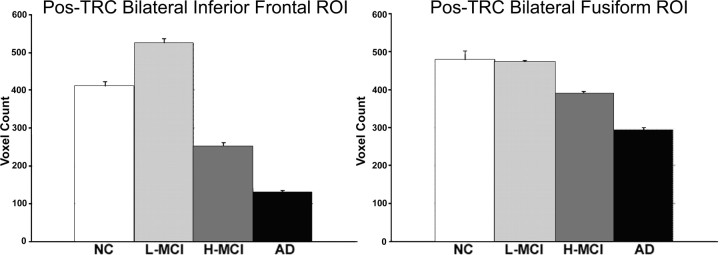
Figure 6.
Pos-TRC ROI analysis. Bar graphs display the results from the ROI voxel count analyses (+SE). a, Low-SB MCI (L-MCI) subjects demonstrated hyperactivation within the bilateral inferior frontal ROI, supporting the theory of a nonlinear trajectory over the course of preclinical AD. All groups were significantly different (p < 0.0001). b, The bilateral fusiform ROI did not appear to be a region sensitive to hyperactivation. All between-group differences were significant within both ROIs (p < 0.0001), except for the difference between NC and low-SB MCI subjects within the fusiform ROI (p = 0.73).

