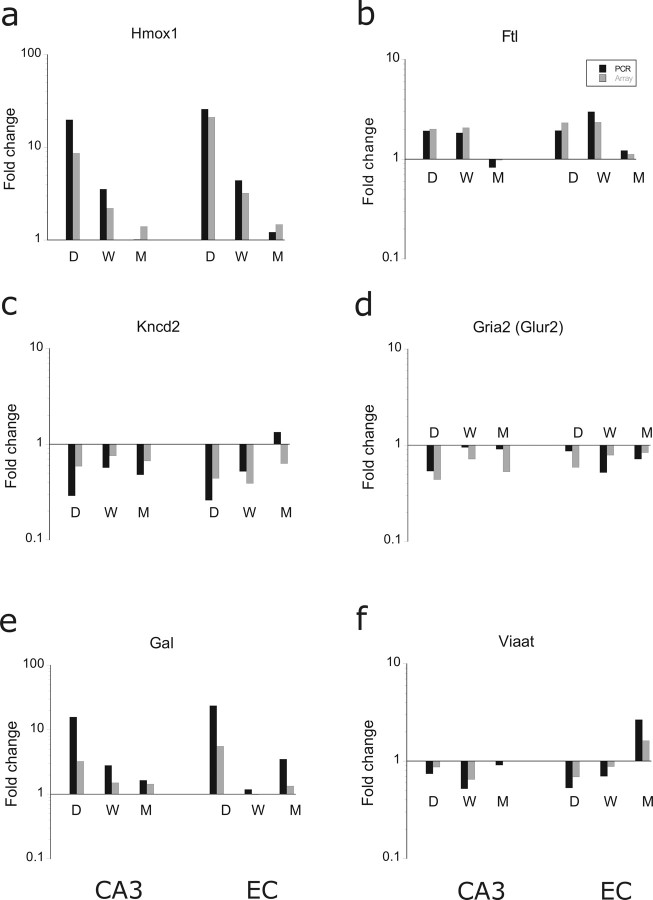
Figure 11.
PCR comparison with array expression. Graphs showing the fold change (with respect to control) during the post-SE time points in CA3 and EC. PCR analysis shows a large correspondence with the array expression patterns of the different genes. Hmox1, Heme oxygenase 1; Ftl, Ferritin light chain 1; Kncd2, potassium voltage-gated channel, Shal-related family 2; Gria2, ionotropic glutamate receptor subunit 2; Gal, galanin; Viaat, vesicular inhibitory amino acid transporter.

