
Figure 5.
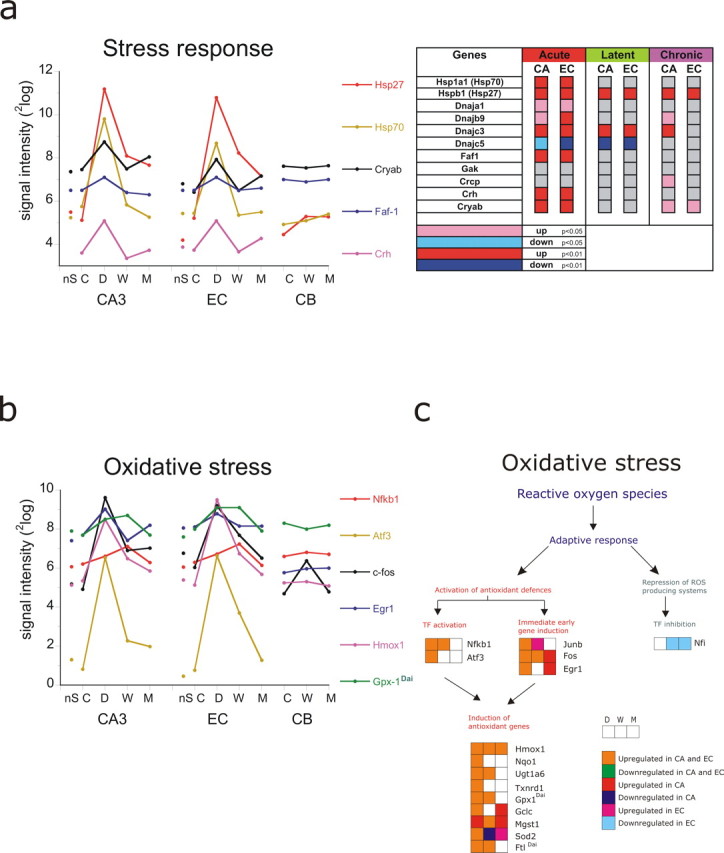
Changes in gene expression after SE related to stress response (a) and oxidative stress (b). Graphs show the signal intensity of six to eight genes in CA3, EC, and CB in the non-SE group (nS), the control group (C), 1 d after SE (D), 1 week after SE (W), and during the chronic phase (M). The statistics of the genes within the GO process are displayed in a color-coded map next to the graph. Genes with a significant change in CA3 or EC of <0.01 are coded in red (up) or dark blue (down), and genes that changed with p < 0.05 are coded in pink (up) and light blue (down). c, Scheme adapted from Morel et al. (1999) that shows the adaptive response during each phase (DWM) on reactive oxygen species. Orange indicates upregulated in CA3 and EC, and green is downregulated in CA3 and EC. Red is upregulated in CA3 only. Pink is upregulated in EC only. Blue is downregulated in CA3 only. Light blue is downregulated in EC only. Gene abbreviations are presented in Table 4.