
Figure 4.
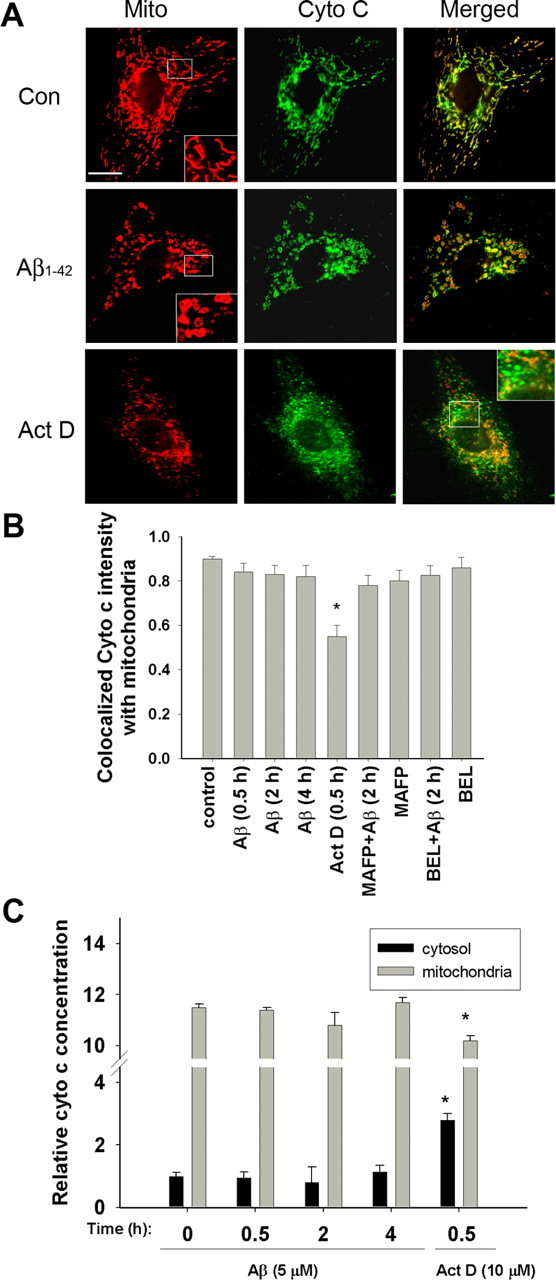
Fluorescence confocal microscopy of cytochrome c and mitochondria in astrocytes. A, Astrocytes were treated without Aβ1–42 (5 μm) for 0.5, 2, and 4 h before immunostaining and confocal microscopy for cytochrome c and MitoTracker Red CMXRos. Actinomycin D (10 μm) was added to astrocytes for 30 min and used as a positive control. Inset, A magnified image to depict mitochondrial morphology. Aβ1–42 did not induce mitochondrial cytochrome c release for up to 4 h. As a positive control, mitochondrial cytochrome c release was induced by treating cells with actinomycin D. Scale bar, 15 μm. B, Quantitative analysis of merged images to depict colocalization between cytochrome c and mitochondria. Data obtained from confocal images showed that ∼90% of the cytochrome c was colocalized with mitochondria in controls. Aβ1–42 did not alter the colocalization of cytochrome c with mitochondria, indicating that cytochrome c was not released. However, treatment of astrocytes with actinomycin D caused significant (*p < 0.01) release of cytochrome c from mitochondria. Values are mean ± SD obtained from at least 36 cells from three independent experiments. C, Cytochrome c release as determined by the ELISA protocol.