
Figure 5.
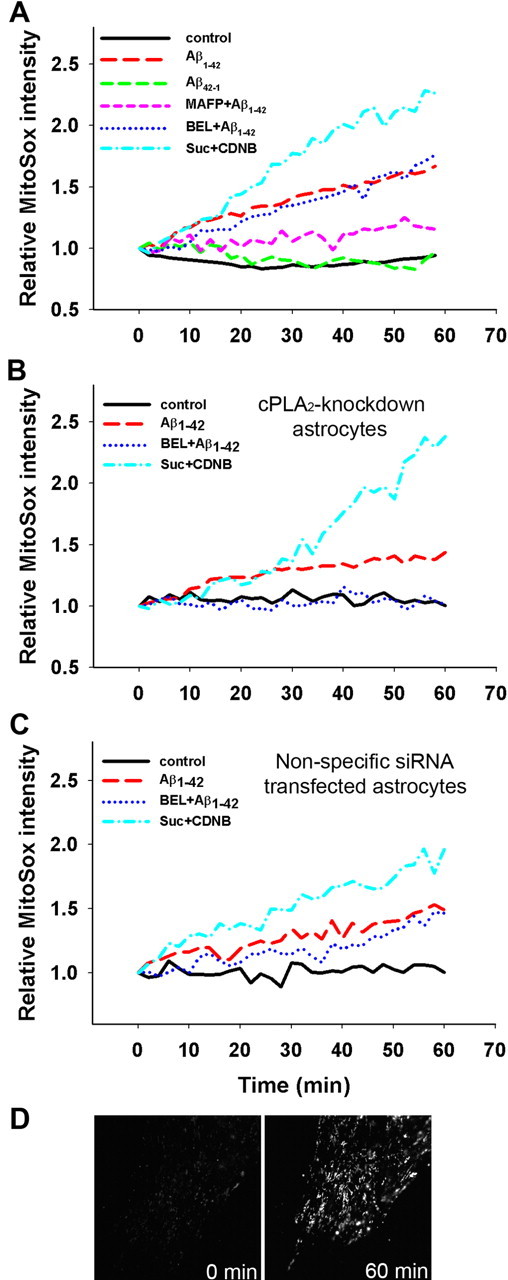
Mitochondrial ROS production measured by MitoSox. Astrocytes were pretreated with MAFP (5 μm), or BEL (5 μm) for 30 min and then exposed to Aβ1–42 (5 μm) or Aβ42–1 (5 μm). Mitochondrial ROS production was assessed by measuring fluorescent intensity of MitoSox at 2 min intervals for 60 min. A, ROS production in control astrocytes. Aβ1–42, but not Aβ42–1, caused significant mitochondrial ROS production in astrocytes, and MAFP significantly suppressed Aβ1–42-induced ROS production. Data also show that BEL suppressed Aβ1–42-induced ROS production for the initial 10 min after addition of Aβ1–42. B, ROS production in cPLA2 knockdown astrocytes by siRNA. Addition of BEL completely suppressed Aβ1–42-induced ROS production. Data represent one typical trial from three independent experiments. C, ROS production in astrocytes transfected with nonspecific siRNA. The results were consistent with those observed using control astrocytes. D, Fluorescent micrographs of MitoSox in astrocytes. Fluorescent images were taken at 0 min (left) and 60 min (right) after Aβ1–42 (5 μm) treatment.