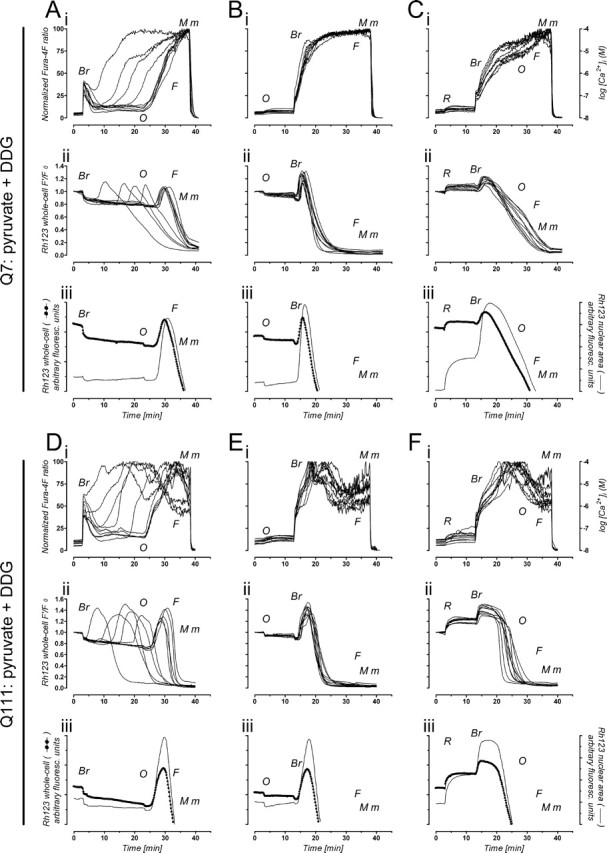
Figure 2.

Ca2+ handling and Δψm in STHdh cells without active glycolysis. Q7 cells (top panel; A–C) and Q111 cells (bottom panel; D–F) were loaded with fura-4F and Rh123 and assayed in the absence of glucose, in buffer containing 10 mm pyruvate and 2 mm DDG. Where indicated, the following drugs were added: 7 μm 4Br-A23187 (Br), 2 μg/ml oligomycin (O), 1 μm FCCP (F), and 2 μm rotenone (R). Maximal (M) and minimal (m) Ca2+ signals were used to normalize fura-4F ratios of individual cells; the right yy-axis is an approximation (see Materials and Methods). A–F, i, Individual Ca2+ responses of 10 representative cells; ii, individual changes in Rh123 whole-cell F′/F0 fluorescence ratios for the same single cells; iii, average change in Rh123 fluorescence (cells collapsing Δψm before oligomycin in Aii and Dii were excluded from the averaging) in the nuclear area (thin line), in comparison with the average change in whole-cell Rh123 fluorescence (dotted line). In each individual experiment, 40–100 random single cells were analyzed; only 10 are shown for clarity but are representative of n = 3–5 independent experiments. See Results for a detailed description of the individual tracings.
