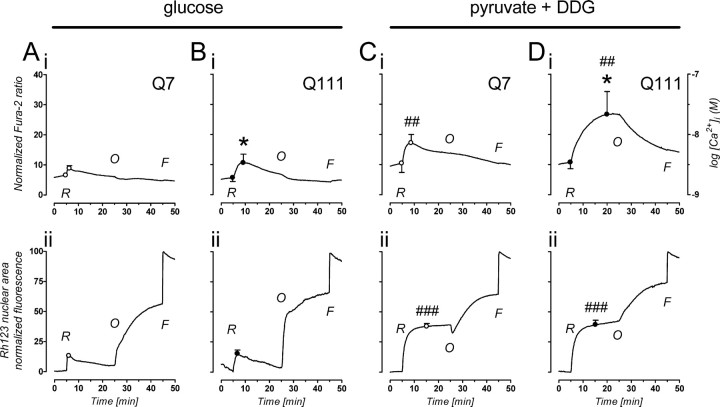
Figure 3.
Comparative effect of mitochondrial inhibitors on [Ca2+]i and Δψm of STHdh cells with or without active glycolysis. Q7 cells (A, C) and Q111 cells (B, D) were loaded with fura-2 (Kd ∼ 0.16 μm) and Rh123 and assayed either in the presence of 5.5 mm glucose (left panel; A, B) or in the absence of glucose, in buffer containing 10 mm pyruvate and 2 mm DDG (right panel; C, D). Changes in fura-2 and Rh123 fluorescence, indicative of [Ca2+]i and Δψm, respectively, were simultaneously imaged in single cells. The following drugs were added sequentially where indicated: 2 μm rotenone (R), 2 μg/ml oligomycin (O), and 1 μm FCCP (F). Maximal and minimal Ca2+ signals (data not shown) were determined at t = 55 and 60 min, respectively, and used to normalize fura-2 ratios of individual cells (see Materials and Methods). A–D, i, Average changes in [Ca2+]i (the left yy-axis spans only up to 40 U for clarity; fura-2 saturated with Ca2+ corresponds to 100 U; the right yy-axis is an approximation as described in Materials and Methods); ii, average changes in Rh123 fluorescence monitored in the nuclear area. Tracings represent the average of n = 3 independent experiments. In each experiment, the individual responses from 20 to 40 random cells were averaged to provide n = 1. Data points used in statistical analysis are highlighted by circles (white, Q7 cells; black, Q111 cells) with SD error bars (bars smaller than circle radius are not visible). Significant differences: *p < 0.05 between genotype (Q7 vs Q111) at same substrate (glucose vs pyruvate plus DDG); ##p < 0.01, ###p < 0.001 between substrates at same genotype. See Results for a detailed description of the individual tracings and statistics.

