
Figure 5.
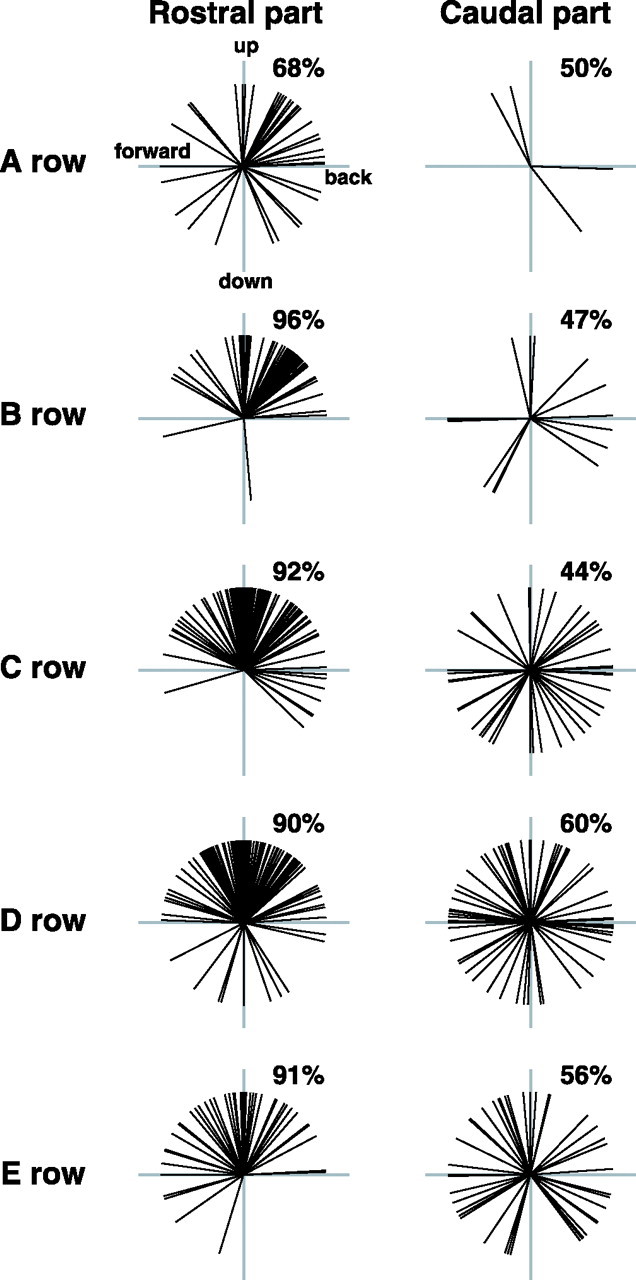
Angular tuning of the responses evoked by vibrissae pertaining to different rows. Vector responses were computed as described in Figure 4A. Percentages above each plot indicate the proportion of vectors in the top quadrants. For cells in the rostral part of the SpVi, but not those in the caudal part, all vector response distributions significantly differ from a 50–50 division between the top and bottom quadrants (0.05 > p > 0.02 for row A, and p < 0.0001 for the other rows; χ2 test).