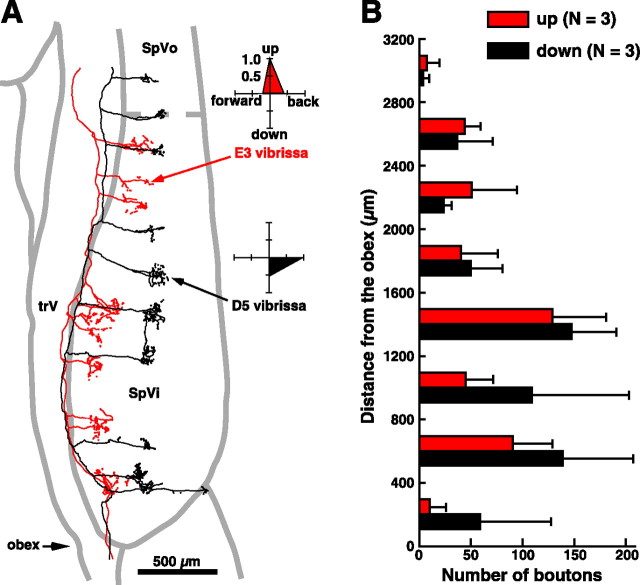
Figure 6.
Distribution of primary afferent terminals in the SpVi. A, The two reconstructed fibers gave off several clusters of terminals along the rostrocaudal extent of the nucleus. The E3-responsive unit best responded to upward vibrissa displacement, whereas the other unit was best driven by backward and downward deflections of vibrissa D5 (A, polar plots). B, The horizontal bar graph shows the grouped distribution of terminal counts of six fibers that were tuned upward (n = 3) or downward (n = 3). Counts are binned at 400 μm intervals starting at the obex. SpVo, Oralis subnucleus; trV, trigeminal tract.

