
Figure 4.
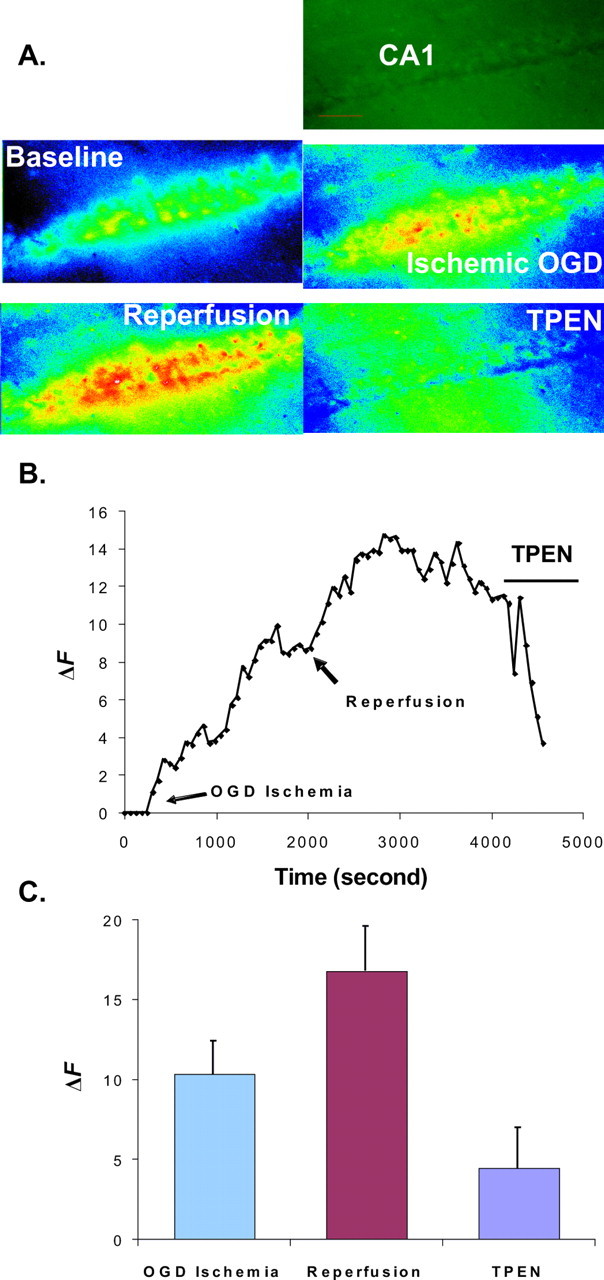
Calcium Green-1 detects [Zn2+]i elevation during ischemia and reperfusion. A, Sequential pseudocolor images of the CA1 region of a hippocampal slice loaded with cell-permeable Calcium Green-1 taken at baseline, OGD, reperfusion, and with the addition of 100 μm TPEN. Images were taken through a 10× Plan-Neofluar objective. The first image is an original image of the baseline. B, Graph showing the typical increases in Calcium Green-1 fluorescence during OGD and reperfusion in a rat hippocampal slice. Arrows show the start of OGD-simulated ischemia and reperfusion, followed by the addition of 100 μm TPEN. TPEN reduced fluorescence intensity. C, Histogram showing the relative fluorescent changes during ischemia, reperfusion, and the addition of TPEN (means ± SE; n = 9). The y-axes in B and C represent the fluorescence emission intensity (F) of the dye/ion complex minus the fluorescence of the baseline (F0). ΔF = F − F0.