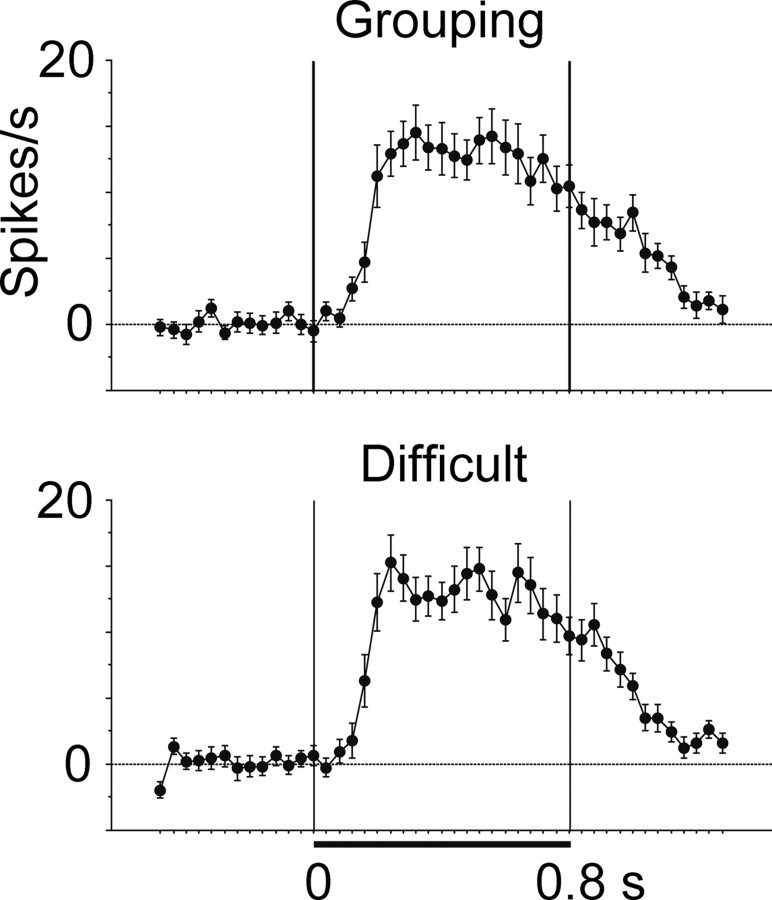
Figure 14.
Comparison of the time course of stimulus selectivity between Grouping (top) and Difficult (bottom) conditions. Only cells that showed significant stimulus selectivity were included. The procedure of analysis was the same as that for Figure 9.

