
Figure 3.
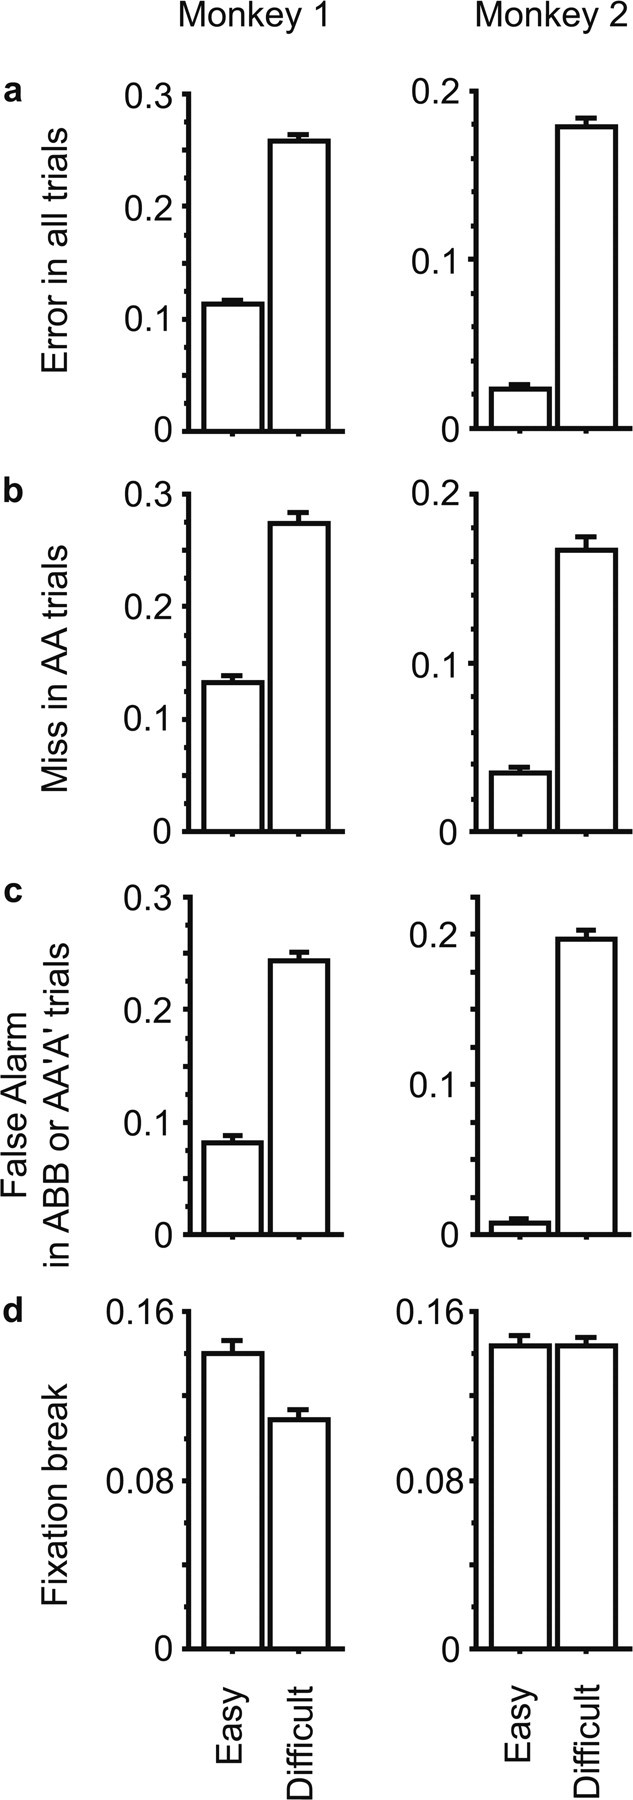
Comparison of the frequency of error trials between Easy and Difficult conditions in monkey 1 (left) and monkey 2 (right). a, Averaged error rates in all trials. b, Averaged miss rate in AA trials. c, Averaged false alarm rate in ABB or AA′A′ trials. d, Averaged fixation break rates. Error bars represent the SEM.