
Figure 4.
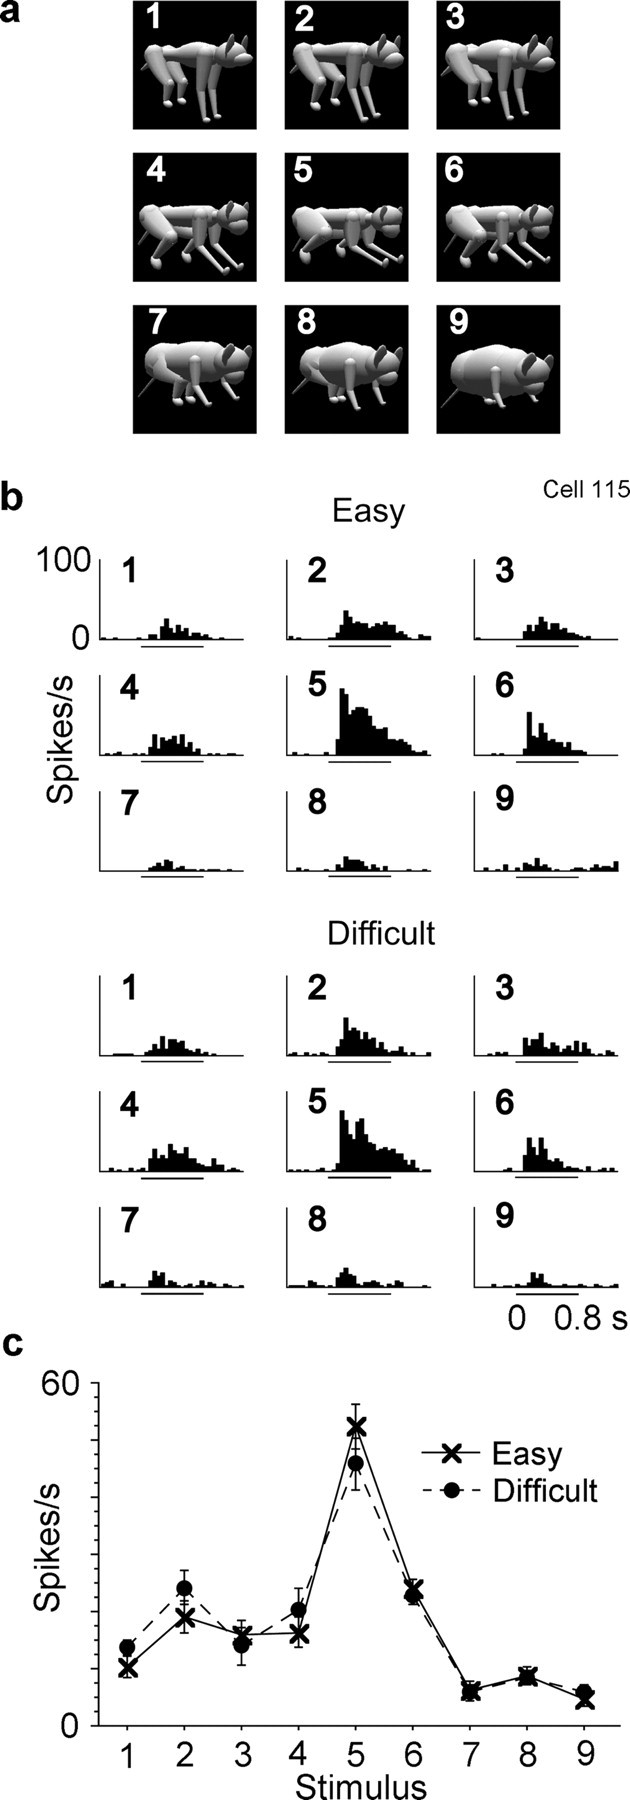
Response of an inferotemporal cell to the nine stimuli. a, The nine stimuli in the same arrangement as those of the PSTH histograms in b. b, PSTH histograms of responses under Easy and Difficult conditions. The numbers in individual histograms correspond to the numbers of the stimuli in a and Figure 1. The lines under the graphs indicate the stimulus presentation period. c, mean firing rate within a window from 80 to 580 ms after the onset of the first stimulus subtracted by the spontaneous firing rate immediately before the stimulus onset. Error bars represent the SEM.