
Figure 8.
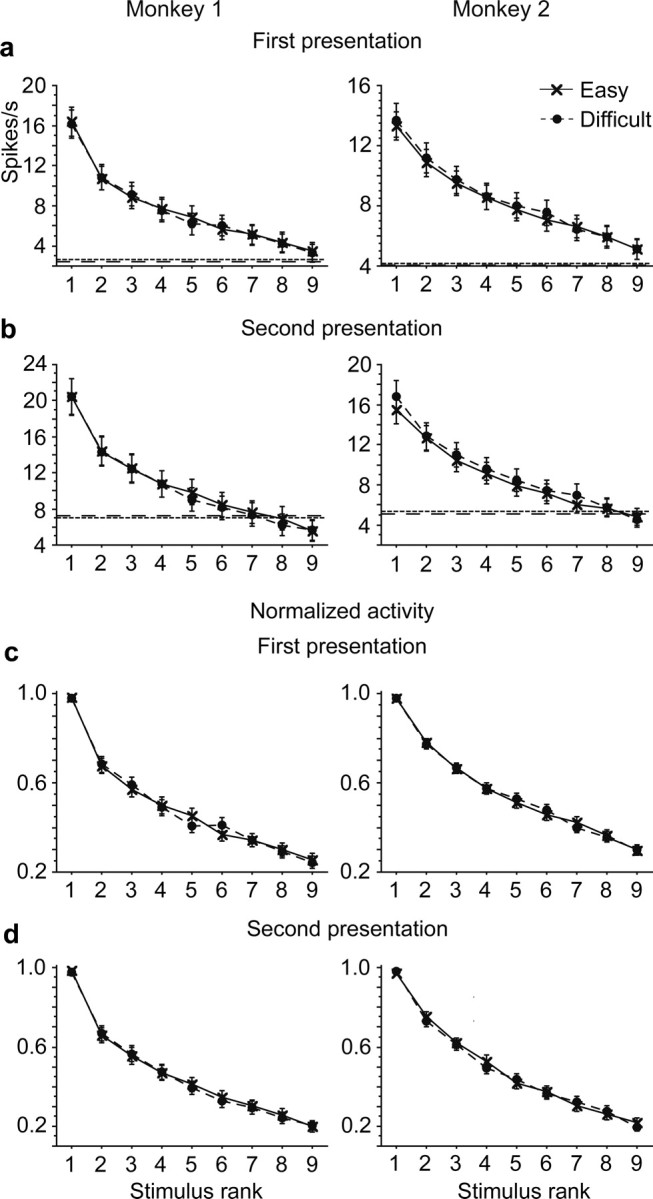
Comparison of tuning curves against stimulus rank in monkey 1 (left) and monkey 2 (right). a, Original magnitudes of responses to the first stimulus were averaged for the stimulus rank order. The spontaneous firing rate was not subtracted in this analysis. The stimulus rank order was determined in individual cells based on the responses averaged between Easy and Difficult conditions. The response magnitudes were aligned according to the stimulus rank order before they were averaged across cells. b, Original magnitudes of responses to the second stimulus. c, The magnitudes of the responses to the first stimulus were normalized by the maximal responses of individual cells before they were averaged across cells. d, The magnitudes of the responses to the second stimulus normalized before averaging across cells. Only cells that showed significant stimulus selectivity contributed in a–d. Error bars represent the SEM.