


Figure 2.
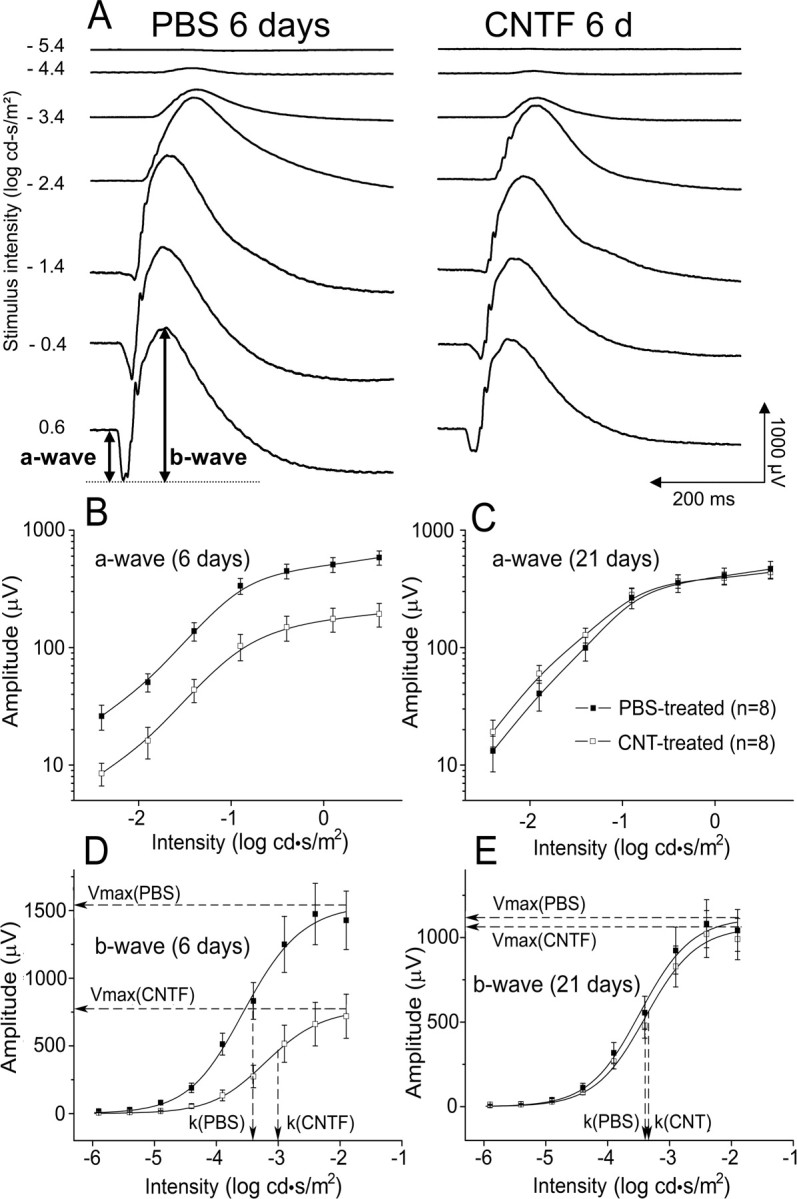
Dark-adapted ERG responses. A, ERG waveforms at increasing stimulus intensities from top to bottom. Average amplitudes of the a-wave (B, C) and the b-wave (D, C) at each intensity at 6 d (B, D) and 21 d (C, E) after CNTF injection into the left eye and PBS injection into the right eye. CNTF treatment induced a significant decrease in the a- and b-wave 6 d after injection. No significant difference between CNTF- and PBS-treated eyes in either a- or b-wave was seen 21 d after injection. Solid lines in B and C are B-spline curves through the data points. Solid lines in D and E are the averaged Naka–Rushton function fits. Dashed lines indicate Vmax and k values from these fits. Data points are averages of eight animals, and error bars are ±SEM.