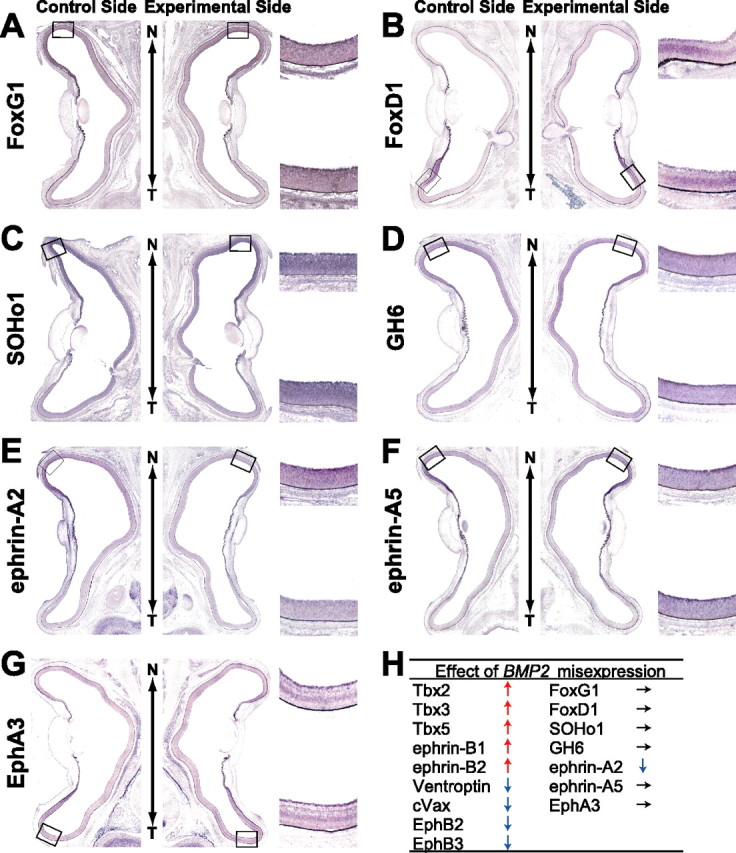
Figure 6.

The effect of BMP2 misexpression on the expression of topographic molecules along the N-T axis. In situ hybridization of horizontal sections of the retinas of E8 embryos after DOX treatment is shown. RCASDC/rtTA and RCAN-TRE/BMP2 were simultaneously electroporated at E1.5. Control retinas and transfected retinas are shown on the left and right, respectively. Expression of FoxG1 (A), FoxD1 (B), SOHo1 (C), GH6 (D), ephrin-A5 (F), and EphA3 (G) was not changed. In contrast, ephrin-A2 (E) was downregulated by BMP2 misexpression. The results of BMP2 misexpression in this and Figure 5 are summarized in H.
