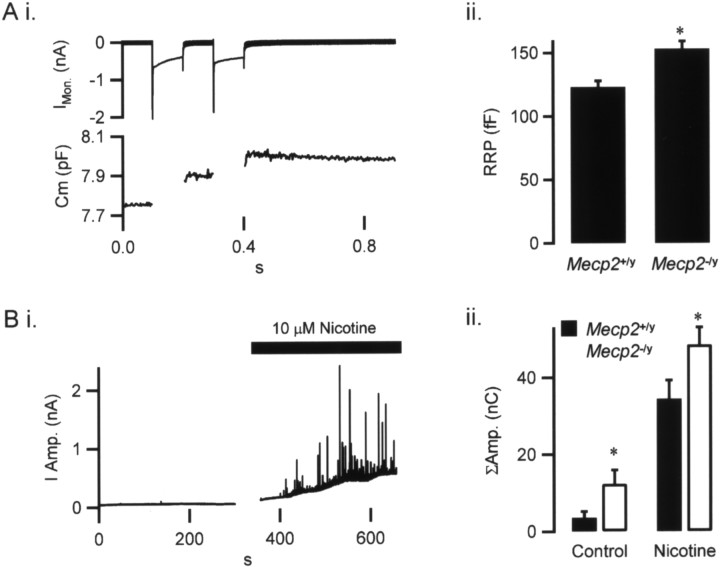
Figure 4.
Mecp2 −/y adrenal chromaffin cells exhibit an increase in the catecholamine RRP and evoked release. The RRP was quantified in wild-type and Mecp2 −/y chromaffin cells as described previously (Gillis et al., 1996). Ai, Cells were voltage clamped at −80 mV and stimulated with a pair of 100 ms depolarizations, first to 0 mV and then to +5 mV, to balance Ca2+ influx. The top trace shows evoked current influx (IMon.), and the bottom trace shows cell capacitance (Cm). In this example, the first pulse resulted in a greater capacitance increase than the second pulse (Cm1 and Cm2, respectively), reflecting a consumption of release-ready granules by the first pulse, leaving few for the second pulse to access. Formally, the RRP can thus be quantified as follows: RRP = S/(1 − R 2), where S is the sum of Cm1 and Cm2 and R is the ratio of Cm2 to Cm1. Aii, This dual-pulse protocol was repeated on MeCP2+/y and MeCP2−/y cells. The quantified RRP sizes from Mecp2 +/y and Mecp2 −/y records (n = 36 and 65, respectively) are summarized and show that the RRP was significantly larger in the Mecp2 −/y (*p < 0.02, paired Student’s t test). Bi, To correlate the increased RRP to evoked catecholamine release, the amperometric (I Amp.) current was measured from chromaffin cells in control Ringer’s solution and during nicotine stimulation. A representative record from Mecp2 +/+ chromaffin tissue is plotted. Bii, Amperometric currents (ΣAmp.) recorded under this protocol from Mecp2 +/y and Mecp2 −/y cells were integrated to allow relative comparison of catecholamine release (n = 8 and 10 for Mecp2 +/y and Mecp2 −/y cells, respectively). These data show significant increases in both spontaneous and evoked catecholamine release from Mecp2 −/y cells compared with Mecp2 +/y (*p < 0.02, paired Student’s t test).

