Figure 2.
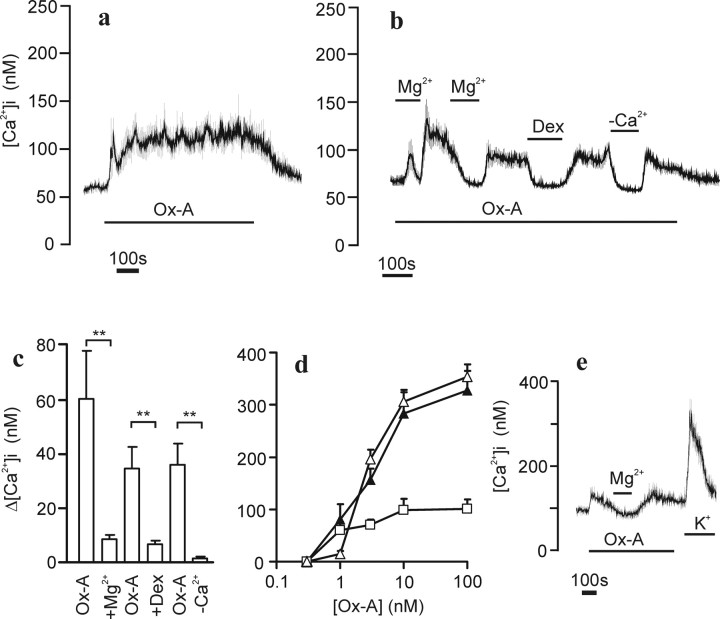
Effect of Mg2+ and dextromethorphan on the orexin-A-stimulated Ca2+ influx. Experimental conditions were as in Figure 1. a, Cells (average ± SD of 32 cells) were continuously challenged with 1 nm orexin-A (Ox-A) to illustrate the stable [Ca2+]i elevation. b, A trace (average ± SD of 23 cells) of cells stimulated with 1 nm orexin-A and the effect of 10 mm Mg2+, 100 μm dextromethorphan (Dex), or a nominally Ca2+-free HBM (−Ca2+). c, The averages ± SEM from six experiments measured under similar conditions as in b. d, The dose–response relationships in the presence (open triangles) or absence (filled triangles) of high [Mg2+]. The Δ[Ca2+]i increase after removal of 10 mm Mg2+ is additionally plotted (open squares). Data represent averages ± SEM from three to five experiments. e, Areas containing only processes were monitored under similar conditions as in b with a subsequent depolarization with 70 mm K+. Note that the regions of interest were larger than the areas of the processes and therefore the magnitude of the response is underestimated.

