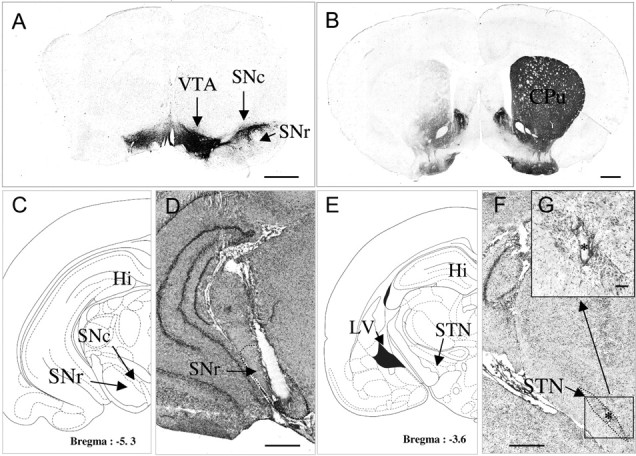
Figure 1.

A, B, D, F, G, Photographs of TH-immunostained coronal rat brain sections at the nigral (A) and striatal (B) levels and of cresyl violet-stained coronal rat brain sections at the nigral (D) and subthalamic (F, G) levels in 6-OHDA-lesioned rats. C, E, Schematic diagrams adapted from the stereotaxic atlas of Paxinos and Watson, (1982). A, B, Note on the lesioned side (left) the loss of dopaminergic cells in the SNc (A) and the loss of dopaminergic terminals in the striatum (B). D, F, G, Note also the correct implantation of the microdialysis probe in the SNr (D) and of the stimulation electrode within the STN (F, G). F, The asterisk indicates the point stimulated. Scale bar, 1 mm. G, Coronal section, at a higher magnification, through the subthalamus (corresponding to the area limited by a square in F) in SNc-lesioned animals on the lesioned side. Scale bars, 0.1 mm. CPu, Caudate–putamen; Hi, hippocampus; LV, lateral ventricle; VTA, ventral tegmental area.
