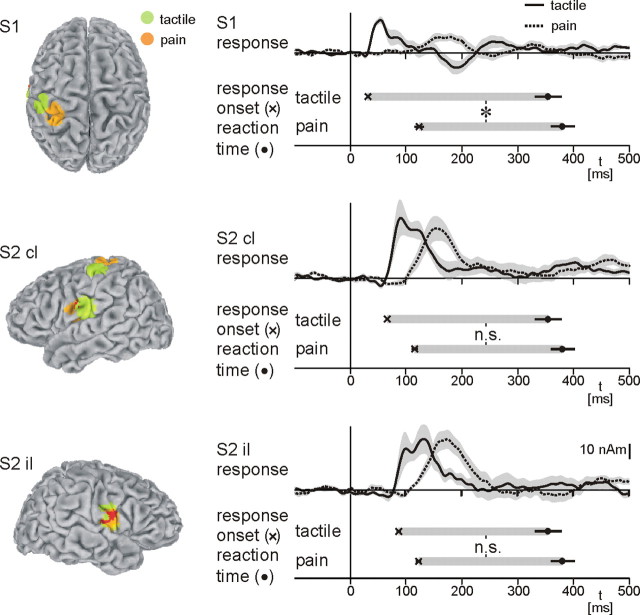
Figure 3.
Local cortical responses, reaction times, and latencies between local cortical responses and reaction times. Locations of responses to painful and tactile stimulation were calculated as group mean normalized dipole locations. Mean coordinates of responses to painful stimuli are as follows: S1, −30, −34, 65; contralateral S2, −52, −4, 18; ipsilateral S2, 50, −8, 15. Mean coordinates of responses to tactile stimuli are as follows: S1, −46, −23, 58; contralateral S2, −56, −14, 21; ipsilateral S2 49, −10, 20. The latency difference between earliest local responses (S1, contralateral S2, and ipsilateral S2) and reaction times represents the local equivalent of the central processing time of Figure 2, which refers to global cortical responses. Shaded areas in the time course panels depict ±SEM. Error bars refer to SEM. cl, Contralateral; il, ipsilateral. *p < 0.05, Wilcoxon's signed-rank test.

