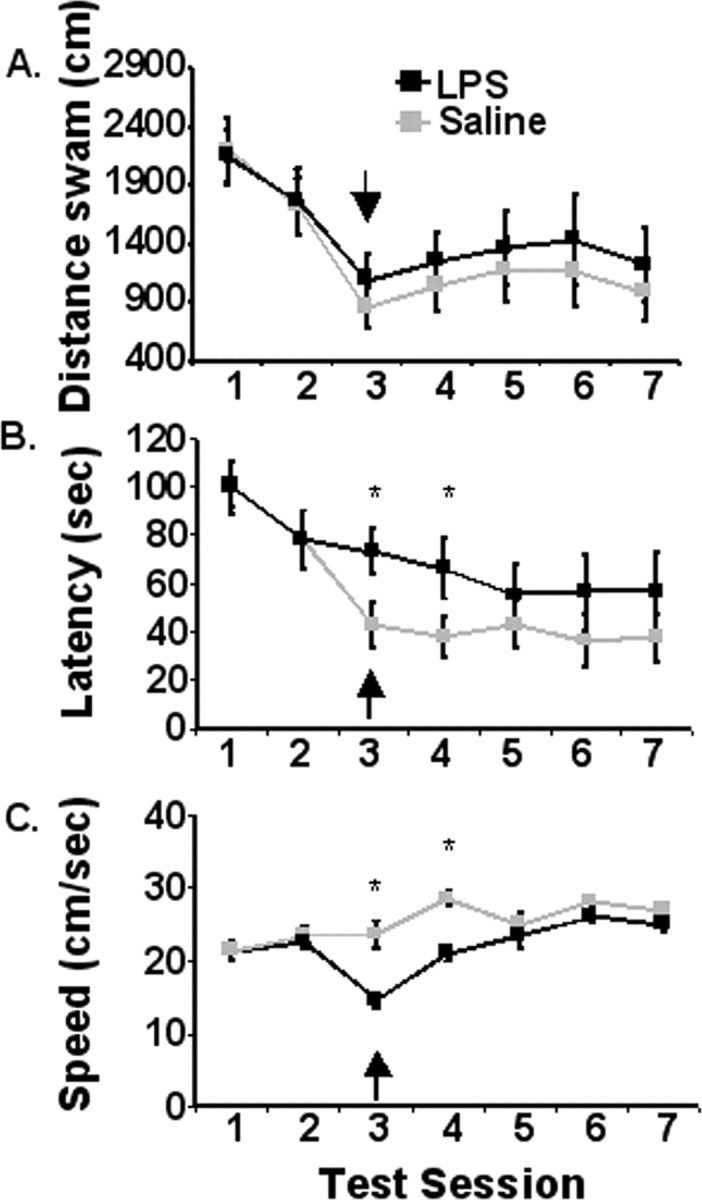
Figure 1.

Matching-to-place performance for IL-6+/+ mice that received LPS (black line) or saline (gray line) 4 h before test session 3. A, Distance swam to platform across testing days. B, Latency to find the platform across testing days. C, Swim speed. Data are presented as mean±SEM. The arrow designates day of treatment. *Significant difference between groups as determined by Fisher's protected least-significant difference (p < 0.05).
