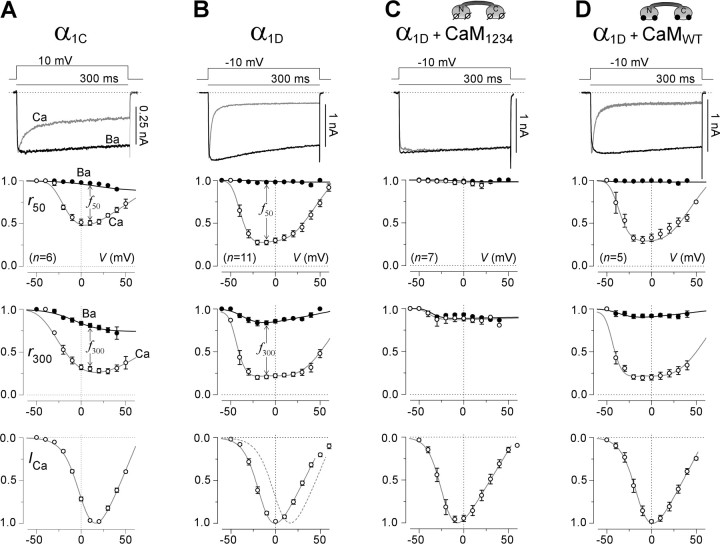
Figure 1.
CaV1.3 Ca2+ channels manifest ultrastrong CDI driven exclusively by CaM. A, Prototypical CDI exhibited by CaV1.2 Ca2+ channels (α1C/β2a/α2δ). Top, Voltage protocol and exemplar whole-cell currents. Here and throughout, the scale bar for current refers to Ca2+ waveforms, and the Ba2+ waveforms are scaled down approximately three times to facilitate visual comparison of decay kinetics. Top middle, Fraction of peak current remaining after 50 ms depolarization (r50), plotted as a function of step potential. The distance between Ba2+ and Ca2+ relations gauges kinetics of CDI. Bottom middle, Fraction of peak current remaining after 300 ms depolarization (r300), plotted as a function of step potential. The distance between Ba2+ and Ca2+ relations gauges steady-state extent of CDI. Bottom, Normalized I--V relation, taken from peak Ca2+ currents evoked by voltage steps to the indicated potentials. B, Ultrastrong CDI exhibited by CaV1.3 Ca2+ channels (α1Dsh/β2a/α2δ). Format as above in A. Bottom middle, Distance between Ba2+ and Ca2+ r300 relations at −10 mV (f300) furnishes simple metric of steady-state extent of CDI. Bottom, Dashed curve reproduces fit to normalized I–V relation for CaV1.2 from A. f50 = 0.70 ± 0.02 (n = 11); f300 = 0.63 ± 0.02 (n = 11). C, Elimination of CDI during coexpression of CaV1.3 channels with CaM1234. Format as above in A. f50 = 0.04 ± 0.03 (n = 7); f300 = 0.06 ± 0.04 (n = 7). D, CDI during coexpression of CaV1.3 channels with CaMWT. Format as above in A. No appreciable difference from profile in B. f50 = 0.69 ± 0.04 (n = 5); f300 = 0.72 ± 0.02 (n = 5).

