
Figure 2.
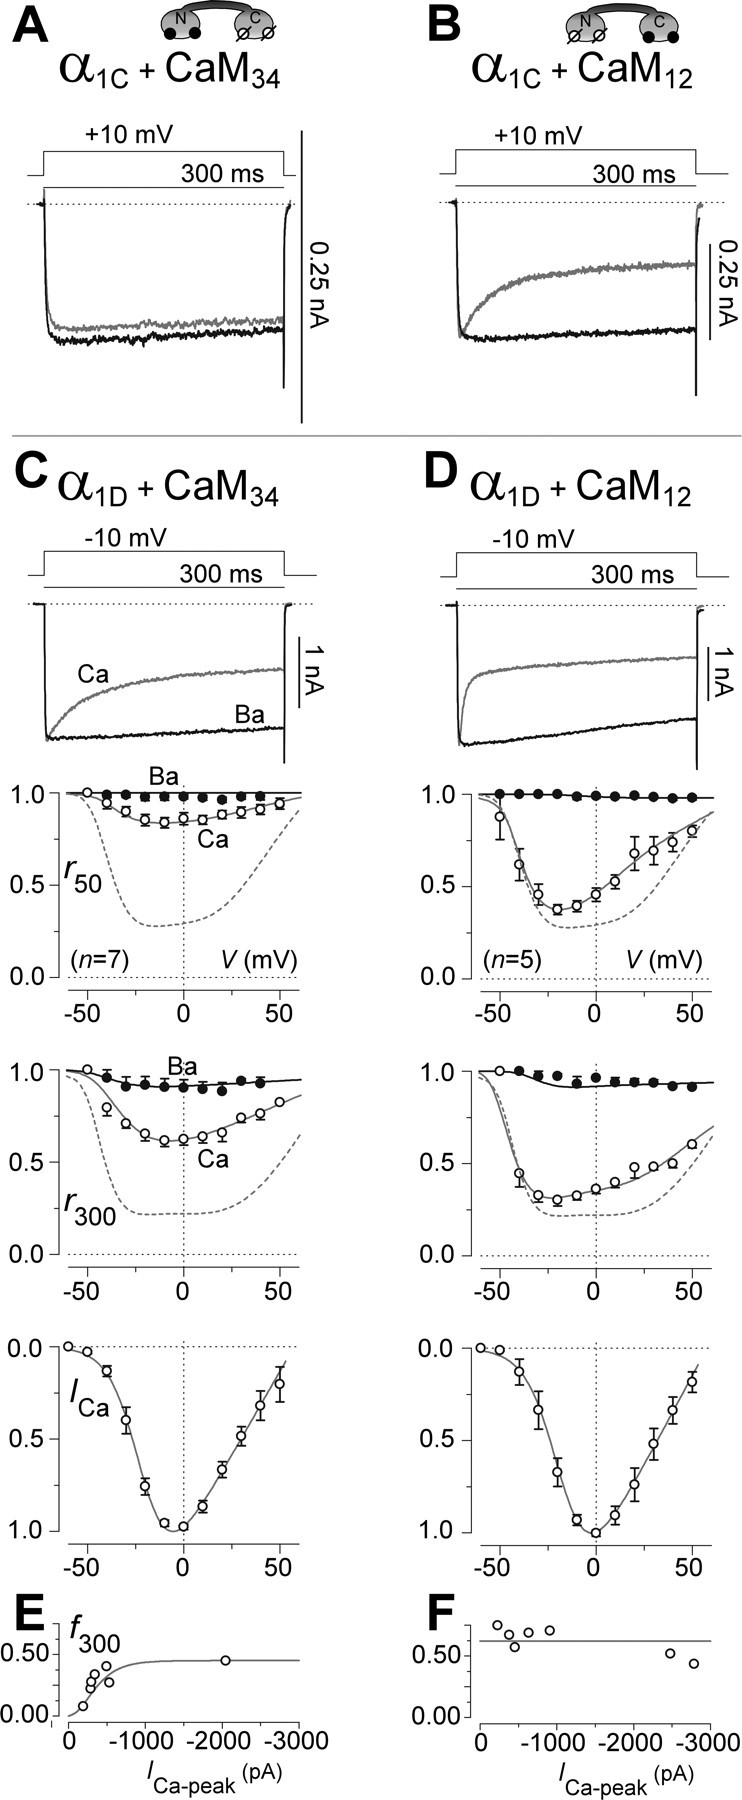
CaM lobe-specific contributions to CDI of CaV1.2 and CaV1.3 channels. A, Exemplar currents showing elimination of CDI during coexpression of CaV1.2 channels with CaM34. Format as in Figure 1A, top row. B, Exemplar currents showing sparing of CDI during coexpression of CaV1.2 channels with CaM12. Format as in top row of Figure 1A. C, Persistence of a slowly inactivating phase of CDI during coexpression of CaV1.3 channels with CaM34. Format as in Figure 1B. Top and bottom middle, Dashed curves reproduce fits to control r50 and r300 relations, shown in Figure 1B. f50 = 0.14 ± 0.03 (n = 7); f300 = 0.29 ± 0.05 (n = 7). D, Persistence of a rapidly inactivating phase of CDI during coexpression of CaV1.3 channels with CaM12. Format as above in C. f50 = 0.61 ± 0.03 (n = 7); f300 = 0.62 ± 0.04 (n = 7). E, Strength of CDI (f300) increases with peak Ca2+ current amplitude (ICa-peak) during coexpression of CaV1.3 channels with CaM34. F, Strength of CDI (f300) invariant with peak Ca2+ current amplitude (ICa-peak) during coexpression of CaV1.3 channels with CaM12.