Figure 4.
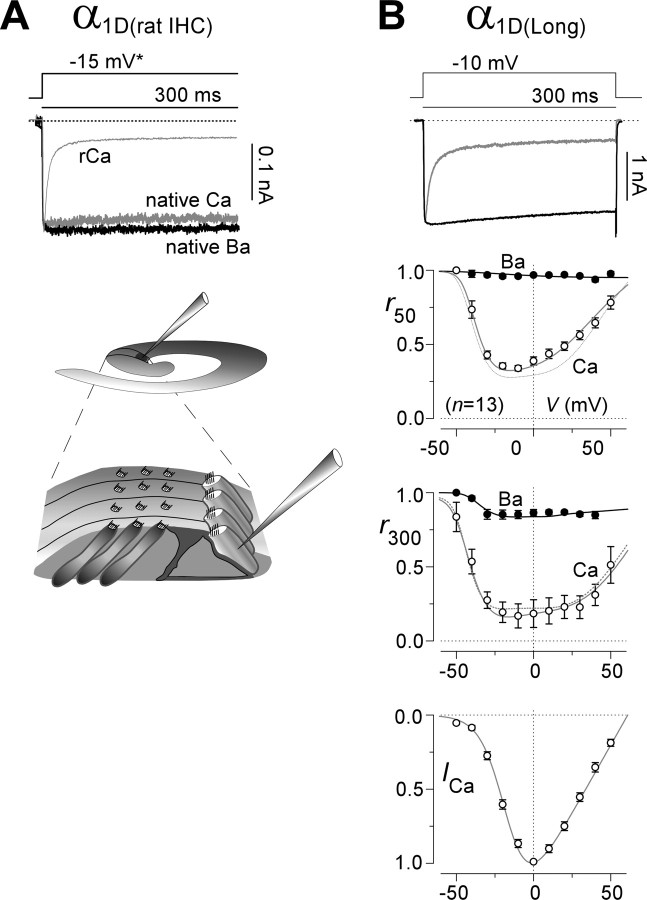
CDI of native IHC Ca2+ channels (A) and unchanged CDI of CaV1.3 Ca2+ channels containing a long α1D splice variant (B). A, Top, Direct comparison of CDI for native IHC Ca2+ channels with that for recombinant CaV1.3 channels (rCa, recombinant Ca2+ current trace, reproduced from Fig. 1B), as labeled. Native currents were evoked by a −15 mV step, and the recombinant current was evoked by a −10 mV step (asterisk). Native current f300 = 0.008 ± 0.013 (n = 6). Bottom, Schematic of isolated organ of Corti preparation (P8–P9 rats) from which native recordings were made in the apical turn. Top schematic provides orientation; expanded view below illustrates details of the pipette approach to an IHC. B, CDI exhibited by long splice variant CaV1.3 Ca2+ channels (α1Dlg/β2a/α2δ). Format as in Figure 1B. Behavior is no different from that for the short splice variant CaV1.3 Ca2+ channels (α1Dsh/β2a/α2δ), as seen by comparison with dashed curves reproducing fits to control r50 and r300 relations in Figure 1B. f50 = 0.62 ± 0.02 (n = 13); f300 = 0.60 ± 0.03 (n = 13).

