
Figure 5.
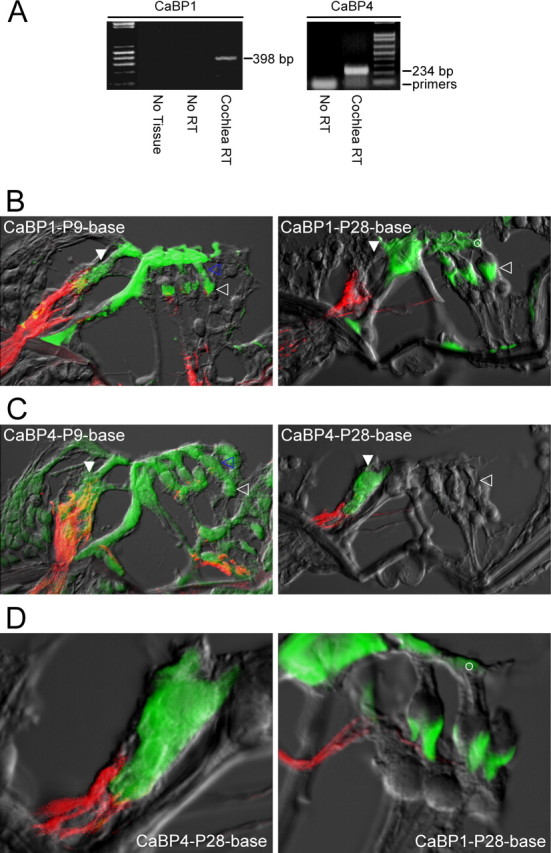
CaBPs express in auditory hair cells. A, Reverse-transcriptase PCR analysis demonstrating the presence of transcripts for CaBP1 (left) and CaBP4 (right) in rat cochlear tissue (P10). “Cochlear RT” lanes show PCR products amplified from reverse transcriptase reactions performed on cochlear tissue; explicit sequencing of these products confirmed the presence of CaBP1 (left) and CaBP4 (right) transcripts (supplemental data, section 2, available at www.jneurosci.org as supplemental material). “No RT” controls document the results of the identical procedures with omission of the reverse transcriptase step. “No Tissue” controls reflect the results when all procedures were performed, with omission of cochlear tissue. B, CaBP1 immunostains of sections obtained from basal turns of the rat organ of Corti (here and throughout the figure), as derived from P9 and P28 rats. Green fluorescence signal reports CaBP1 staining; red fluorescence registers neurofilament 200 staining characteristic of afferent nerves; and gray signal reflects scanned transmitted light image. All three signals were imaged by confocal microscopy and digitally merged. At P9, CaBP1 signals shows diffuse expression in both IHCs (filled white arrow, next to afferent nerve connection) and OHCs (open blue arrow). By P28, CaBP1 is preferentially localized to chalices of Deiters cells (open white arrow), as well as to the cuticular plates of OHCs (open white circle). CaBP1 labeling of pillar cells is of unknown significance. OHCs are oriented on the right, here and throughout. C, CaBP4 immunostains of sections obtained from rat organ of Corti, derived from P9 and P28 rats. At P9, CaBP4 shows diffuse expression in both IHCs (filled white arrow) and OHCs (open blue arrow), as well as in Deiters cells (open white arrow). By P28, CaBP4 is preferentially localized to IHCs. CaBP4 labeling of pillar cells at P9 is of unknown significance. D, Higher-power views of P28 rat sections demonstrating selective CaBP4 enrichment within IHCs (left). The right panel illustrates adult CaBP1 enhancement of “chalice” processes from Deiters cells, the cuticular plates of OHCs (open white circles), and multiple segments of pilar cells.