Figure 6.
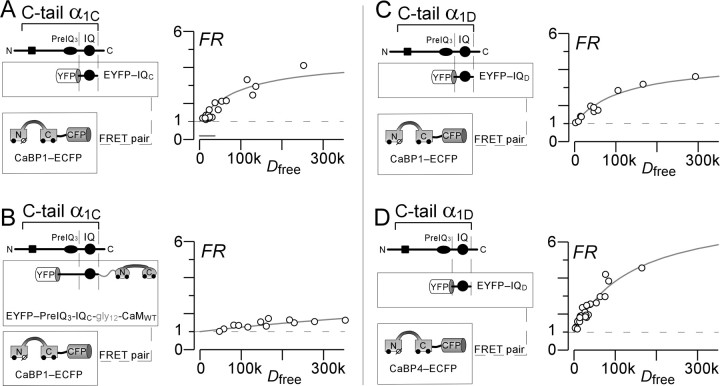
CaBPs interact with the CaV1.3 IQ segment. A, FRET two-hybrid assays performed on resting live HEK293 cells coexpressing YFP–IQC with CaBP1–CFP, as schematized on the left. The right graph shows binding-curve analysis of FRET interactions. FRET strength (FR) determined for each cell (circle) is plotted versus the free relative donor (CaBP1–CFP) concentration, Dfree. Smooth curves show binding-curve fit to data, indicating a relative dissociation constant Kd,EFF = 100,000 and maximal FRET ratio FRmax = 4.5. Bar approximates 500 nm calibration (Erickson et al., 2003). B, FRET two-hybrid assays performed pairing YFP–PreIQ3-IQC-gly12-CaMWT with CaBP1–CFP. The format is as in A. Binding-curve analysis yields an ultrahigh relative dissociation constant Kd,EFF ∼ 131,000 and maximal FRET ratio FRmax = 4.5. The enormous elevation of Kd,EFF compared with A is consistent with mutually exclusive binding of CaMWT and CaBP1 to this region of the channel. C, FRET two-hybrid assays performed pairing YFP–IQD with CaBP1–CFP, with format as in A. Binding-curve analysis yields a relative dissociation constant Kd,EFF = 116,880 and maximal FRET ratio FRmax = 4.5. D, FRET two-hybrid assays performed pairing YFP–IQD with CaBP4–CFP. Format as in A. Binding-curve analysis yields a relative dissociation constant Kd,EFF = 142,272 and maximal FRET ratio FRmax = 7.8.

