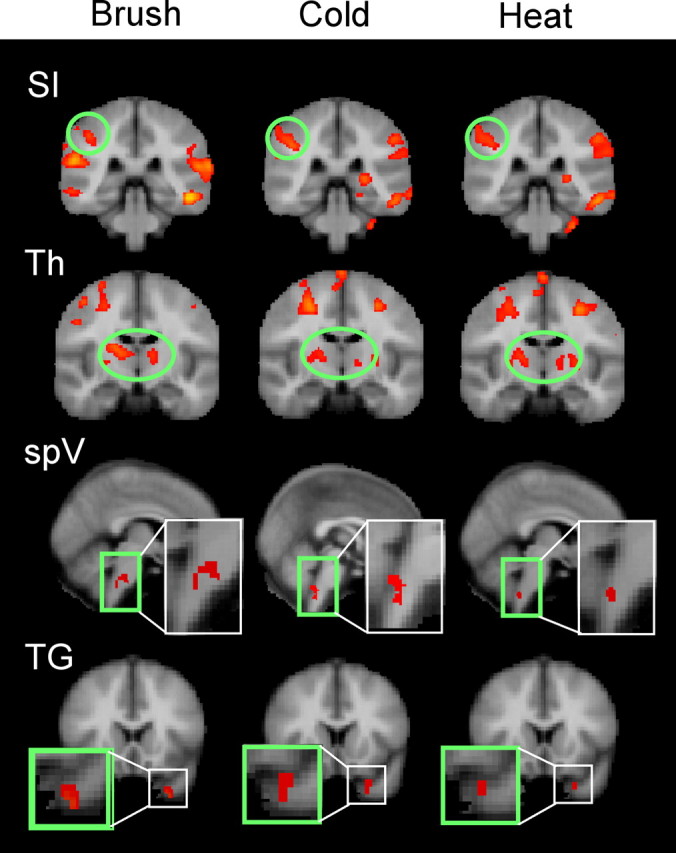
Figure 2.

Group analysis for the trigeminal pathway. Specific activations along the trigeminal pathway (SI, thalamus, spV, and TG) are presented for the three stimuli. SI displayed similar activation across the three stimuli; the thalamus seemed to have a more medial activation with brush compared with heat and cold. Aggregate image analysis of the TG and trigeminal nuclei did not meet statistical threshold. Subthreshold activation was seen for spV in brush, but only spV for heat and cold. The TG activated similarly for the three stimuli. Quantified analysis through an ROI-based analysis is shown in Figure 3. Th, Thalamus.
