
Figure 7.
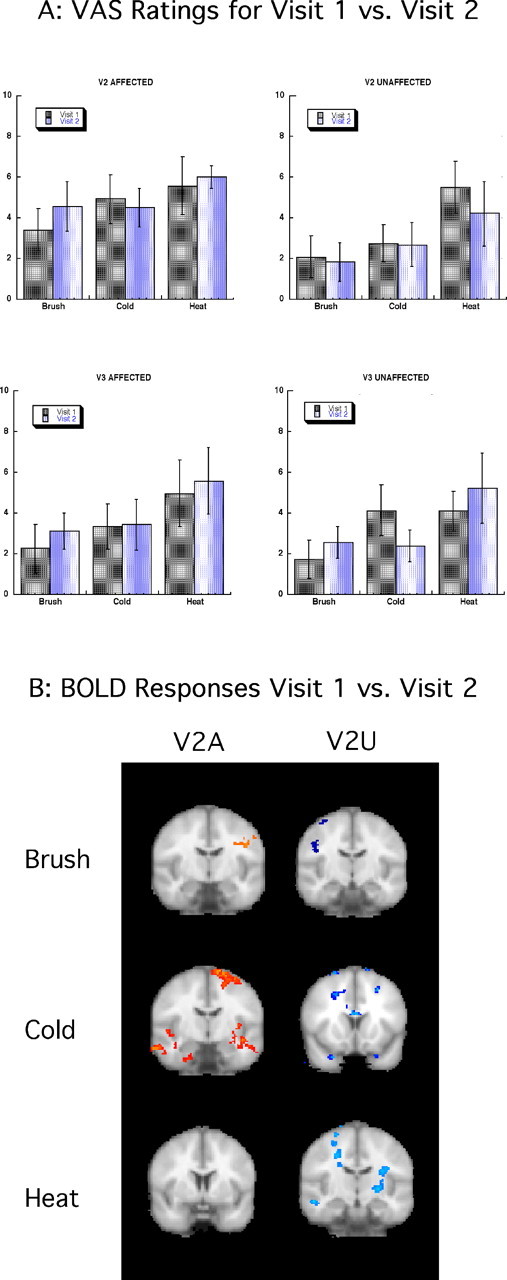
Reproducibility of results: visit 1 versus visit 2. A, VAS ratings for visits 1 and 2. VAS scores for all the stimulated areas for all stimuli are presented indicating no significant differences for on-line VAS scores between sessions. Error bars indicate SEM. B, BOLD responses for visits 1 and 2. fMRI results showed no significant differences between sessions. Activations are located, for the most part, in white-matter tracts.